. 2014 Aug 1;117(3):289-96.
doi: 10.1152/japplphysiol.00044.2014. Epub 2014 May 29.

Sustained AS160 and TBC1D1 phosphorylations in human skeletal muscle 30 min after a single bout of exercise

Affiliations

Sustained AS160 and TBC1D1 phosphorylations in human skeletal muscle 30 min after a single bout of exercise

M H Vendelbo et al. J Appl Physiol (1985). .

Abstract

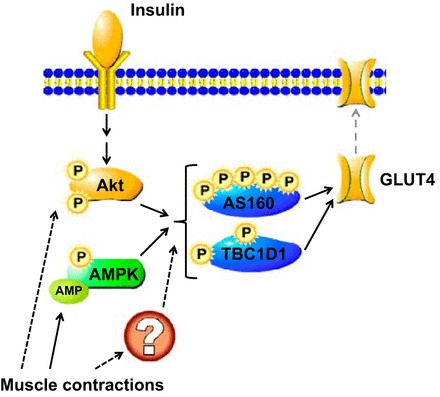
Background: phosphorylation of AS160 and TBC1D1 plays an important role for GLUT4 mobilization to the cell surface. The phosphorylation of AS160 and TBC1D1 in humans in response to acute exercise is not fully characterized.

Objective: to study AS160 and TBC1D1 phosphorylation in human skeletal muscle after aerobic exercise followed by a hyperinsulinemic euglycemic clamp.

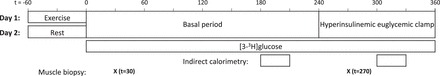
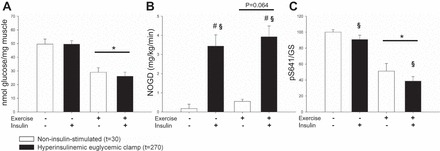
Design: eight healthy men were studied on two occasions: 1) in the resting state and 2) in the hours after a 1-h bout of ergometer cycling. A hyperinsulinemic euglycemic clamp was initiated 240 min after exercise and in a time-matched nonexercised control condition. We obtained muscle biopsies 30 min after exercise and in a time-matched nonexercised control condition (t = 30) and after 30 min of insulin stimulation (t = 270) and investigated site-specific phosphorylation of AS160 and TBC1D1.

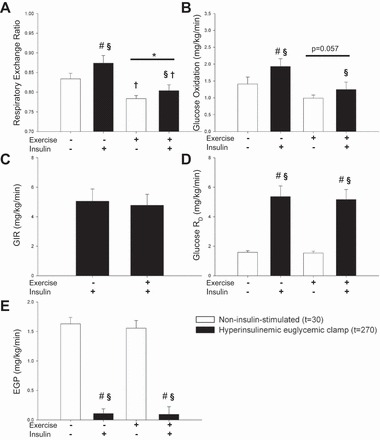
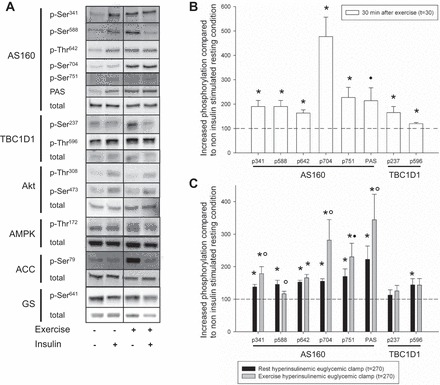
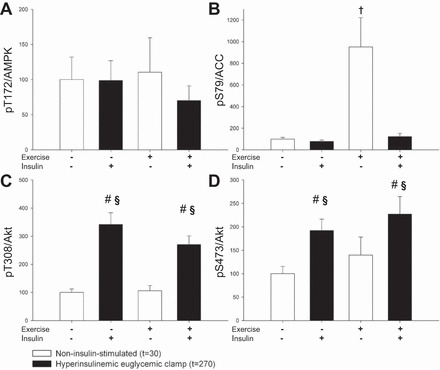
Results: phosphorylation on AS160 and TBC1D1 was increased 30 min after the exercise bout, whereas phosphorylation of the putative upstream kinases, Akt and AMPK, was unchanged compared with resting control condition. Exercise augmented insulin-stimulated phosphorylation on AS160 at Ser(341) and Ser(704) 270 min after exercise. No additional exercise effects were observed on insulin-stimulated phosphorylation of Thr(642) and Ser(588) on AS160 or Ser(237) and Thr(596) on TBC1D1.

Conclusions: AS160 and TBC1D1 phosphorylations were evident 30 min after exercise without simultaneously increased Akt and AMPK phosphorylation. Unlike TBC1D1, insulin-stimulated site-specific AS160 phosphorylation is modified by prior exercise, but these sites do not include Thr(642) and Ser(588). Together, these data provide new insights into phosphorylation of key regulators of glucose transport in human skeletal muscle.

Keywords: AS160; TBC1D1; TBC1D4; endurance exercise; insulin sensitivity; skeletal muscle.


Figures

Fig. 1.
Fig. 1.
Study protocol. Subjects were examined on 2 days: 1) after an overnight fast of 10 h and 1 h ergometer cycling at 65% V̇o2 peak (Exercise) and 2) after an overnight fast of 10 h (Rest). On both experimental days an infusion of [3-3H]glucose tracer was initiated at t = 0 to measure glucose uptake during a basal period (t = 0–240) and during a 2-h hyperinsulinemic euglycemic clamp (t = 240–360). Indirect calorimetry was performed at t = 180–210 and t = 300–330. At t = 30 and 270 min, a muscle biopsy was obtained from vastus lateralis of the quadriceps femoris muscle.
Fig. 2.
Fig. 2.
Respiratory exchange ratio, glucose uptake, and glucose metabolism were determined after an overnight fast (rest) and after one h ergometer cycling at 65% VO2-peak (Exercise). Throughout the figure open bars indicate a noninsulin-stimulated condition at t = 30 and closed bars indicate a hyperinsulinemic euglycemic clamp condition at t = 270. A: main effect of experimental day and hyperinsulinemic euglycemic clamp was observed on respiratory exchange ratio (RER). Post hoc testing revealed that exercise decreased RER both during insulin and noninsulin-stimulated conditions, whereas RER increased only during the hyperinsulinemic euglycemic clamp on the resting day. (main effect of experimental day = *P < 0.05, main effect of hyperinsulinemic euglycemic clamp = §P < 0.05, #P < 0.05 vs. basal within experimental day, †P < 0.05 vs. resting within noninsulin-stimulated condition or hyperinsulinemic euglycemic clamp). B and C: glucose infusion rate (GIR) and glucose rate of disappearance (RD) were not affected by exercise, and during the hyperinsulinemic euglycemic clamp, glucose RD was markedly increased. D: there was a trend toward decreased glucose oxidation after exercise. There was a main effect of the hyperinsulinemic euglycemic clamp on glucose oxidation; however, this effect was not significant after exercise when post hoc test was applied. E: endogenous glucose production (EGP) was not affected by exercise and equally suppressed during the hyperinsulinemic euglycemic clamp.
Fig. 3.
Fig. 3.
Effect of 1 h ergometer cycling at 65% V̇o2 peak (exercise) on signaling to GLUT4 translocation was assessed with Western blotting. A: representative blots of phosphorylated and total protein expression of AS160, TBC1D1, AMPK, ACC, Akt, and glycogen synthase after an overnight fast (rest) and after exercise during noninsulin-stimulated and insulin-stimulated conditions. B: open bars indicate increase in site-specific phosphorylation 30 min after exercise compared with time-matched nonexercised control condition (dashed line) on AS160 and TBC1D1. All site-specific phosphorylations increased after exercise (*P < 0.05), whereas the nonspecific phosphorylation detected with the PAS antibody revealed a trend for only an increase compared with resting condition at 30 min (P = 0.068). Standard errors for site-specific AS160 and TBC1D1 phosphorylation in resting condition at 30 min were: AS160 p-Ser341 = 11.60, p-Ser588 = 8.34, p-Thr642 = 5.05, p-Ser704 = 10.30, p-Ser751 = 10.36, PAS = 22.02, and TBC1D1 p-Ser237 = 12.95, p-Thr596 = 14.26. Presented protein phosphorylations are expressed as a ratio of total protein expression. C: solid and shaded bars indicate increase in site-specific phosphorylation during insulin stimulation (t = 270) compared with resting condition at 30 min (dashed line) during resting and postexercise conditions, respectively. Phosphorylation on all AS160 sites and TBC1D1 Thr596 was increased by insulin stimulation at 270 min compared with without insulin at 30 min on the resting day (*P < 0.05). Insulin-induced phosphorylation was augmented by exercise on Ser341, Ser704, and PAS (P < 0.05) at 270 min compared with time-matched nonexercised control condition, and a trend was observed on Ser751 (P = 0.072). No additional exercise effect was seen on AS160 Thr642 at 270 min compared with time-matched nonexercised control condition, and no insulin effect was observed on Ser588 after exercise at 270 min compared with without insulin at 30 min on the resting day. Presented protein phosphorylations are expressed as a ratio of total protein expression.
Fig. 4.
Fig. 4.
Effect of 1 h ergometer cycling at 65% V̇o2 peak (exercise) in noninsulin-stimulated condition at t = 30 and insulin-stimulated condition at t = 270 on the upstream (AMPK and Akt) kinases of AS160 and TBC1D1. Throughout the figure, open bars indicate a noninsulin-stimulated condition and closed bars indicate an insulin-stimulated condition. A and B: no change in AMPK Thr172 phosphorylation was detected after exercise; however, downstream ACC Ser79 phosphorylation was increased (†P < 0.05 vs. resting within noninsulin-stimulated condition). C and D: increased Akt Thr308 and Ser473 phosphorylation was observed during insulin stimulation without any exercise effect (main effect of hyperinsulinemic euglycemic clamp = §P < 0.05, #P < 0.05 vs. basal within experimental day).
Fig. 5.
Fig. 5.
Glycogen and glycogen metabolism were determined after an overnight fast (rest) and after 1 h ergometer cycling at 65% V̇o2 peak (Exercise). Throughout the figure, open bars indicate a noninsulin-stimulated condition and closed bars indicate an insulin-stimulated condition. A: glycogen stores were significantly reduced during exercise (main effect of experimental day = *P < 0.05). B: nonoxidative glucose disposal (NOGD) was increased during insulin stimulation, and exercise tended to increase NOGD (main effect of hyperinsulinemic euglycemic clamp = §P < 0.05, #P < 0.05 vs. basal within experimental day). C: Ser641 phosphorylation on glycogen synthase (GS) was significantly reduced by both exercise and insulin stimulation, indicating increased GS activity.
Fig. 6.
Fig. 6.
Schematic overview of the regulation of GLUT4 translocation. Insulin stimulates Akt phosphorylation and activity, whereas muscle contraction activates AMPK by inducing phosphorylation of Thr172 and by allosteric activation by AMP. Muscle contraction can also activate Akt, but the importance of this signaling pathway for glucose uptake remains unclear. AMPK and Akt are established kinases of the phosphorylation sites on AS160 and TBC1D1 investigated in this study, but other kinases activated by muscle contraction could also be involved. P, phosphorylation; ?, putative protein or mechanism. Solid arrows illustrate established relationships between stimuli, signals, and glucose transport; dashed arrows are used for putative interactions.

Similar articles

Cited by

References

    1. An D, Toyoda T, Taylor EB, Yu H, Fujii N, Hirshman MF, Goodyear LJ. TBC1D1 regulates insulin- and contraction-induced glucose transport in mouse skeletal muscle. Diabetes 59: 1358–1365, 2010. - PMC - PubMed
    1. Arias EB, Kim J, Funai K, Cartee GD. Prior exercise increases phosphorylation of Akt substrate of 160 kDa (AS160) in rat skeletal muscle. Am J Physiol Endocrinol Metab 292: E1191–E1200, 2007. - PubMed
    1. Bogardus C, Thuillez P, Ravussin E, Vasquez B, Narimiga M, Azhar S. Effect of muscle glycogen depletion on in vivo insulin action in man. J Clin Invest 72: 1605–1610, 1983. - PMC - PubMed
    1. Bondar RJ, Mead DC. Evaluation of glucose-6-phosphate dehydrogenase from Leuconostoc mesenteroides in the hexokinase method for determining glucose in serum. Clin Chem 20: 586–590, 1974. - PubMed
    1. Catoire M, Mensink M, Boekschoten MV, Hangelbroek R, Muller M, Schrauwen P, Kersten S. Pronounced effects of acute endurance exercise on gene expression in resting and exercising human skeletal muscle. PLoS One 7: e51066, 2012. - PMC - PubMed

Publication types