. 2014 Jul 25;289(30):20960-9.
doi: 10.1074/jbc.M114.573642. Epub 2014 May 29.

Predicting enzyme adsorption to lignin films by calculating enzyme surface hydrophobicity

Affiliations

Predicting enzyme adsorption to lignin films by calculating enzyme surface hydrophobicity

Deanne W Sammond et al. J Biol Chem. .

Abstract

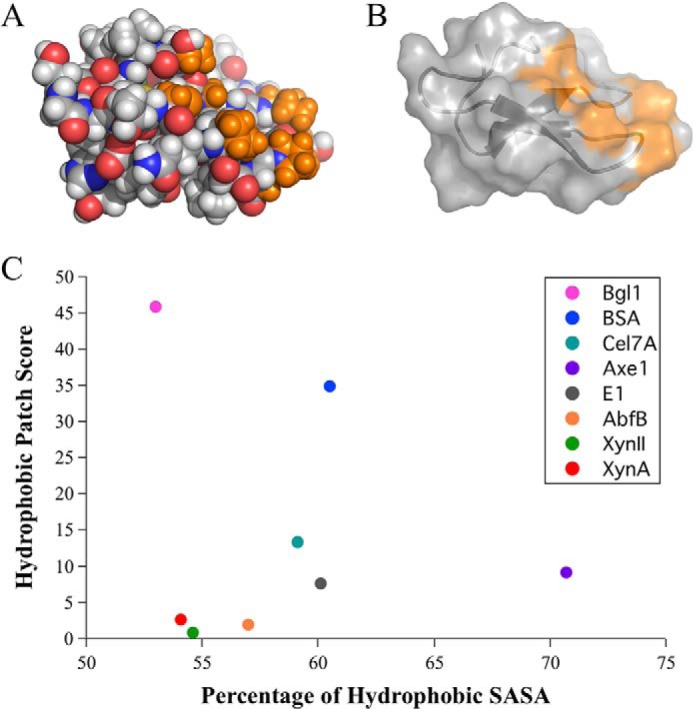
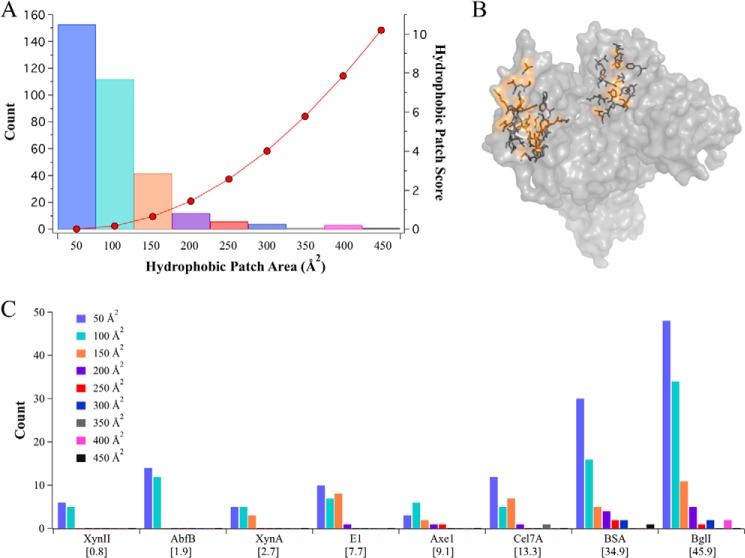
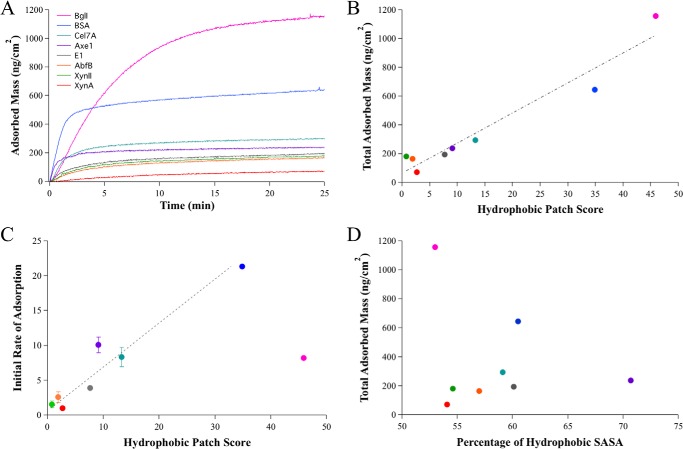
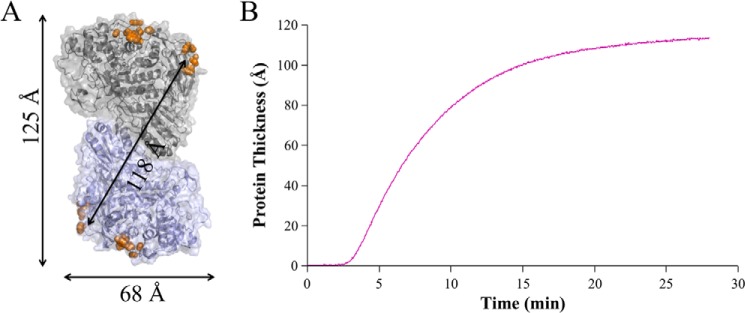
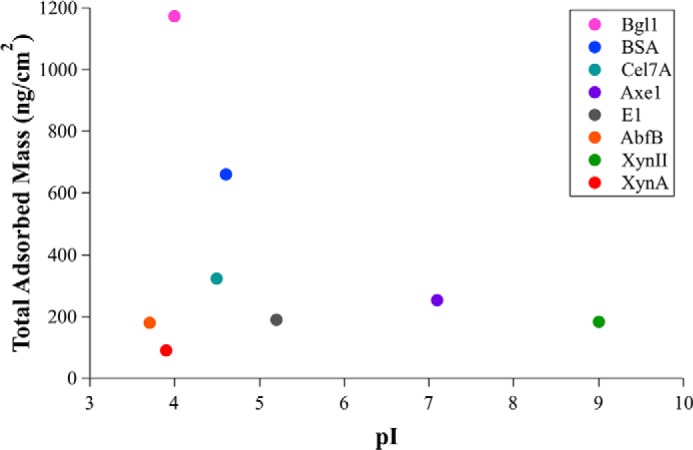
The inhibitory action of lignin on cellulase cocktails is a major challenge to the biological saccharification of plant cell wall polysaccharides. Although the mechanism remains unclear, hydrophobic interactions between enzymes and lignin are hypothesized to drive adsorption. Here we evaluate the role of hydrophobic interactions in enzyme-lignin binding. The hydrophobicity of the enzyme surface was quantified using an estimation of the clustering of nonpolar atoms, identifying potential interaction sites. The adsorption of enzymes to lignin surfaces, measured using the quartz crystal microbalance, correlates to the hydrophobic cluster scores. Further, these results suggest a minimum hydrophobic cluster size for a protein to preferentially adsorb to lignin. The impact of electrostatic contribution was ruled out by comparing the isoelectric point (pI) values to the adsorption of proteins to lignin surfaces. These results demonstrate the ability to predict enzyme-lignin adsorption and could potentially be used to design improved cellulase cocktails, thus lowering the overall cost of biofuel production.

Keywords: Cellulase; Enzyme Inhibitor; Glycoside Hydrolase; Hydrophobic Interaction; Lignin; Protein Chemistry; Protein Engineering.


Figures

FIGURE 1.
FIGURE 1.
The total hydrophobic solvent-accessible surface area does not determine the presence of hydrophobic clusters. A, the family 1 carbohydrate-binding module (CBM1, PDB code 1cbh) from T. reesei Cel7A (GH7) is shown in sphere representation, with polar atoms colored red (oxygen) and blue (nitrogen), and nonpolar atoms shown in gray (carbon). Hydrogen atoms are shown in white. Nonpolar atoms from the largest hydrophobic cluster found on CBM1 are shown in orange. B, cartoon and surface representation of the CBM1 shown with the identified hydrophobic cluster highlighted in orange. C, hydrophobic patch scores are plotted against the percentage of hydrophobic SASA to show the lack of correlation between the percentage of hydrophobic SASA and the presence of large solvent-exposed hydrophobic patches as identified by the hydrophobic patch score.
FIGURE 2.
FIGURE 2.
The hydrophobic patch score broken down by the number and size of identified patches for each enzyme suggests a minimum patch size for preferential lignin adsorption. A, the individual hydrophobic patch score for each bin size is shown with red dots (right y axis). The count for each hydrophobic patch size found in the investigated set of proteins is shown with bars (left y axis). B, a surface representation of BSA with two of the four largest identified hydrophobic patches highlighted in orange, and side chains are shown in stick representation. C, the hydrophobic patch scores for each protein are listed in brackets under the protein name under the x axis. The count for each hydrophobic patch size is broken down for each protein. The patch sizes are binned by Å2 of solvent-accessible surface area. Larger patches (>350 Å2 of SASA) are only observed on A. niger BglI and BSA. Because the score increases exponentially for each bin size, the larger hydrophobic patch scores seen in BglI and BSA are explained by the presence of larger hydrophobic patches.
FIGURE 3.
FIGURE 3.
A correlation exists between enzyme-lignin adsorption parameters and the number and size of hydrophobic patches on the surface of enzymes. A, QCM-D adsorption curves for a set of eight enzymes are shown. B, a linear correlation exists between the hydrophobic patch score for each protein and the total change in adsorbed mass on the lignin surfaces. The error bars are so small relative to the differences in areal mass that they are not visible in the graph. The error bars for areal mass for each protein are given in Table 2. C, a correlation is also seen for the initial adsorption rate for the seven monomeric proteins, determined by the slope of the initial linear portion of the adsorption curves and the hydrophobic patch score. The initial rate of adsorption for Bgl1 dimer unexpectedly lags the high adsorption capacity and the large hydrophobic patch score. This data point is shown but not included in the trend line. D, the percentage of hydrophobic SASA does not correlate with the binding capacity as determined by the total adsorbed mass. The error bars for total adsorbed mass are given in Table 2 because they are so small relative to the differences in adsorbed mass that they are not visible in the graph.
FIGURE 4.
FIGURE 4.
A. niger Bgl1 is a homodimer. Native PAGE of A. niger BglI is shown. 30 μg of BglI was run on a 2–12% Native PAGE (Invitrogen) and stained with SimplyBlue protein stain. The protein molecular mass aligns as a dimer, with no detectable band for monomeric species. There is, however, a band running at a higher molecular mass that may be a tetramer or higher order oligomeric species.
FIGURE 5.
FIGURE 5.
The distance of the dimeric structure between hydrophobic patches on A. niger BglI agrees with the thickness of the deposited protein layer as evaluated with QCM-D. A, the modeled BglI dimer is shown in cartoon and surface representation with the four largest hydrophobic patches highlighted with orange spheres. Distances between the hydrophobic patches (125 and 118 Å) are shown with arrows, and the monomer thickness across the short axis is shown below (68 Å). B, the estimated thickness of the BglI protein layer on the lignin surface is shown. The first 3 min is the flow of buffer only, followed by 25 min of protein injection.
FIGURE 6.
FIGURE 6.
There is no correlation between the pI and measured binding capacity to lignin surfaces for the investigated proteins. pI values were averaged for enzymes with multiple bands in the IEF gels to obtain single pI values to compare with adsorbed mass values. The error bars for total adsorbed mass for each protein are given in Table 2 because they are so small relative to the differences in total adsorbed mass that they are not visible in the graph.

References

    1. Klein-Marcuschamer D., Oleskowicz-Popiel P., Simmons B. A., Blanch H. W. (2012) The challenge of enzyme cost in the production of lignocellulosic biofuels. Biotechnol. Bioeng. 109, 1083–1087 - PubMed
    1. Nakagame S., Chandra R. P., Kadla J. F., Saddler J. N. (2011) Enhancing the enzymatic hydrolysis of lignocellulosic biomass by increasing the carboxylic acid content of the associated lignin. Biotechnol. Bioeng. 108, 538–548 - PubMed
    1. Grabber J. H. (2005) How do lignin composition, structure, and cross-linking affect degradability? A review of cell wall model studies. Crop Sci. 45, 820–831
    1. Nakagame S., Chandra R. P., Kadla J. F., Saddler J. N. (2011) The isolation, characterization and effect of lignin isolated from steam pretreated Douglas-fir on the enzymatic hydrolysis of cellulose. Bioresour. Technol. 102, 4507–4517 - PubMed
    1. Rahikainen J. L., Martin-Sampedro R., Heikkinen H., Rovio S., Marjamaa K., Tamminen T., Rojas O. J., Kruus K. (2013) Inhibitory effect of lignin during cellulose bioconversion: the effect of lignin chemistry on non-productive enzyme adsorption. Bioresour. Technol. 133, 270–278 - PubMed

Publication types

MeSH terms