. 2014 Jul 25;289(30):20740-56.
doi: 10.1074/jbc.M114.572404. Epub 2014 May 29.

The Fab conformations in the solution structure of human immunoglobulin G4 (IgG4) restrict access to its Fc region: implications for functional activity

Affiliations

The Fab conformations in the solution structure of human immunoglobulin G4 (IgG4) restrict access to its Fc region: implications for functional activity

Lucy E Rayner et al. J Biol Chem. .

Abstract

Human IgG4 antibody shows therapeutically useful properties compared with the IgG1, IgG2, and IgG3 subclasses. Thus IgG4 does not activate complement and shows conformational variability. These properties are attributable to its hinge region, which is the shortest of the four IgG subclasses. Using high throughput scattering methods, we studied the solution structure of wild-type IgG4(Ser(222)) and a hinge mutant IgG4(Pro(222)) in different buffers and temperatures where the proline substitution suppresses the formation of half-antibody. Analytical ultracentrifugation showed that both IgG4 forms were principally monomeric with sedimentation coefficients s20,w(0) of 6.6-6.8 S. A monomer-dimer equilibrium was observed in heavy water buffer at low temperature. Scattering showed that the x-ray radius of gyration Rg was unchanged with concentration in 50-250 mm NaCl buffers, whereas the neutron Rg values showed a concentration-dependent increase as the temperature decreased in heavy water buffers. The distance distribution curves (P(r)) revealed two peaks, M1 and M2, that shifted below 2 mg/ml to indicate concentration-dependent IgG4 structures in addition to IgG4 dimer formation at high concentration in heavy water. Constrained x-ray and neutron scattering modeling revealed asymmetric solution structures for IgG4(Ser(222)) with extended hinge structures. The IgG4(Pro(222)) structure was similar. Both IgG4 structures showed that their Fab regions were positioned close enough to the Fc region to restrict C1q binding. Our new molecular models for IgG4 explain its inability to activate complement and clarify aspects of its stability and function for therapeutic applications.

Keywords: Analytical Ultracentrifugation; Antibody; Complement; Constrained Modeling; Human IgG4; Neutron Scattering; Protein Structure; X-ray Scattering.


Figures

FIGURE 1.
FIGURE 1.
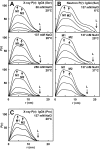
Sedimentation velocity analyses of human IgG4. A, on the left, the experimentally observed sedimentation boundaries for IgG4(Ser222) in PBS-50, PBS-137, and PBS-250 in H2O were recorded at a rotor speed of 40,000 rpm. B, IgG4(Ser222) was measured at 6, 20, and 30 °C in PBS-137 in 2H2O at a rotor speed of 40,000 rpm. C, IgG4(Pro222) in PBS-137 in H2O was also measured at 40,000 rpm. Fifty boundaries (black outlines) are shown from as many as 700 scans at intervals of every e.g. 14th scan for clarity. The SEDFIT fits are shown as white lines. On the right, the observed s values in the corresponding size distribution analyses c(s) revealed a monomer (M) peak at s20,w0 values of ∼6.8 S for IgG4(Ser222) and 6.6 S for IgG4(Pro222) in the H2O buffers together with a minor dimer peak (D) at about 9 S. The observed s values in 2H2O buffers are shifted to lower S values.
FIGURE 2.
FIGURE 2.
Concentration dependence of the IgG4 sedimentation analyses. A, the concentration dependence of the s20,w values for the IgG4 monomer and dimer peaks of Fig. 1 are shown as a function of IgG4(Ser222) concentration. The mean s20,w values are shown as solid lines for PBS-50 (□), PBS-137 (○), and PBS-250 (♢) in H2O buffer at 20 °C and as dotted lines for 6 (▵), 20 (○), and 30 °C (▿) for PBS-137 at 20 °C in 2H2O buffer. Data for IgG4(Pro222) (★) in PBS-137 in H2O at 20 °C are shown as two dashed lines. B, the mean percentages of the major monomer and minor dimer forms from integration of the c(s) analyses are shown for PBS-50, PBS-137, and PBS-250 at 20 °C (solid lines) and at 6, 20, and 30 °C for PBS-137 in 2H2O (dotted lines). Data for IgG4(Pro222) (★) in PBS-137 in H2O at 20 °C are shown as two dashed lines.
FIGURE 3.
FIGURE 3.
Concentration and temperature dependences of the x-ray and neutron Guinier analyses. A, the x-ray Guinier values for IgG4(Ser222) were measured in quadruplicate and averaged and are shown as the mean ± S.D. All the lines show the mean value. Error bars representing S.D. are shown only when larger than the symbol. The x-ray Rg values for IgG4(Ser222) are shown for PBS-50 (□ and ■), PBS-137 (○ and ●), and PBS-250 (♢ and ♦). The open symbols correspond to the Guinier values, and the filled symbols correspond to the P(r) values. The corresponding x-ray I(0)/c, RXS-1, and RXS-2 values are likewise shown for the three buffers. B, the neutron values correspond to single measurements in PBS-137 in 2H2O. The lines correspond to linear regression fits. The Rg values at 6 (▿ and ▾), 20 (○ and ●), and 37 °C (▵ and ▴) are shown with the open symbols corresponding to the Guinier values and filled symbols corresponding to the P(r) values. The corresponding I(0)/c, RXS-1, and RXS-2 values are likewise shown. The fitted line shown for RXS-2 is the mean value. C, the corresponding x-ray Guinier values for IgG4(Pro222) (★) are shown in the same view as that of A.
FIGURE 4.
FIGURE 4.
X-ray and neutron distance distribution analyses P(r) for IgG4. The peak maxima at M1 and M2 and the maximum length at L are indicated by arrows. A, the x-ray P(r) curves for IgG4(Ser222) in PBS-50, PBS-137, and PBS-250 are shown at concentrations between 0.5 and 6 mg/ml. B, the neutron P(r) curves for IgG4(Ser222) in PBS-137 in 2H2O buffer at 6, 20, and 37 °C are shown for concentrations between 2 and 8 mg/ml. C, the x-ray P(r) curves for IgG4(Pro222) in PBS-137 are shown for concentrations between 0.5 and 2 mg/ml.
FIGURE 5.
FIGURE 5.
Concentration dependence of the P(r) analyses for IgG4. A, the x-ray values of the P(r) maxima M1 and M2 are shown for IgG4(Ser222) in PBS-50 (M1, ♢; M2, ♦; dashed line), PBS-137 (M1, ○; M2, ●; solid line), and PBS-250 (M1, □; M2, ■; dotted line). These are compared with the 2010 values (20) for IgG4(Ser222) in PBS-137 (M1, open ×; M2, closed ×). Error bars represent S.D. B, the neutron values for IgG4(Ser222) are shown for 6 (M1, ▿; M2, ▾; dotted line), 20 (M1, ○; M2, ●; solid line), and 37 °C (M1, ▵; M2, ▴; dashed line). C, the pairs of x-ray M1 and M2 values for IgG4(Pro222) in PBS-137 (M1, ★; M2, ☆) are compared with the data for IgG4(Ser222) depicted as lines from A.
FIGURE 6.
FIGURE 6.
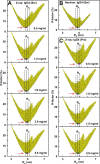
Constrained modeling analysis for IgG4. The 20,000 goodness-of-fit R-factors are compared with the x-ray and neutron Rg values for the conformationally randomized IgG4(Ser222) models. The 20,000 asymmetric and symmetric models are shown in yellow. The 10 best fit models with the lowest R-factors are shown in green of which the best fit model is shown in pink. The experimentally observed Rg values are shown by vertical solid lines to follow the Guinier Rg values (Table 1) with ±5% error ranges shown as dashed lines. A, the hydrated x-ray models are compared with the x-ray curves for IgG4(Ser222) in PBS-137 for each of five concentrations between 0.5 and 6 mg/ml. B, the unhydrated neutron models are compared with the neutron curve for IgG(Ser222) in PBS-137 in 2H2O after linear extrapolation to 0 mg/ml. C, the hydrated x-ray models are compared with the x-ray curves for IgG4(Pro222) in PBS-137 for each of four concentrations between 0.5 and 2 mg/ml.
FIGURE 7.
FIGURE 7.
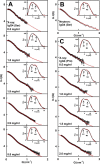
X-ray and neutron scattering curve fits for the best fit IgG4 models. A, IgG4(Ser222) fits in PBS-137 by x-ray scattering. B, IgG4(Ser222) fits in PBS-137 in 2H2O extrapolated to zero concentration by neutron scattering. C, IgG4(Pro222) fits in PBS-137 by x-ray scattering. The experimental data at 20 °C are indicated by circles (black), and the modeled best fit scattering curve is indicated by the continuous line (red). The insets correspond to the experimental (black) and best fit modeled (red) curves in which the M1 and M2 values are indicated by arrows.
FIGURE 8.
FIGURE 8.
The best fit IgG4 models. The 10 best fit models from each analysis are shown superimposed upon their Fc region (red). A, IgG4(Ser222) in PBS-137 (x-rays). B, IgG4(Ser222) in PBS-137 in 2H2O (neutrons). C, IgG4(Pro222) in PBS-137 (x-rays).
FIGURE 9.
FIGURE 9.
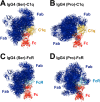
Superimposition of the best fit IgG4 models with C1q and FcR. The 10 best fit models are shown superimposed upon their Fc region (red) upon which the C1q globular head (yellow; Protein Data Bank code 1PK6) (A and B) or the Fc (red)-FcγRIII (cyan) complex (Protein Data Bank code 1E4K) (C and D) are also superimposed. Other Fc-FcR crystal structures (Protein Data Bank codes 1T83 and 1T89) give similar views (not shown). A, C1q head with the x-ray models for 5.8 mg/ml IgG4(Ser222) in PBS-137. B, C1q head with the x-ray models for 2.0 mg/ml IgG4(Pro222) in PBS-137. C, FcγRIII with the x-ray models for 5.8 mg/ml IgG4(Ser222) in PBS-137. D, FcγRIII with the x-ray models for 2.0 mg/ml IgG4(Pro222) in PBS-137.

References

    1. Hamilton R. G. (2001) The Human IgG Subclasses, Calbiochem, La Jolla, CA
    1. Aalberse R. C., Schuurman J., van Ree R. (1999) The apparent monovalency of human IgG4 is due to bispecificity. Int. Arch. Allergy Immunol. 118, 187–189 - PubMed
    1. Rispens T., Ooievaar-De Heer P., Vermeulen E., Schuurman J., van der Neut Kolfschoten M., Aalberse R. C. (2009) Human IgG4 binds to IgG4 and conformationally altered IgG1 via Fc-Fc interactions. J. Immunol. 182, 4275–4281 - PubMed
    1. Aalberse R. C., Schuurman J. (2002) IgG4 breaking the rules. Immunology 105, 9–19 - PMC - PubMed
    1. Wang X., Das T. K., Singh S. K., Kumar S. (2009) Potential aggregation prone regions in biotherapeutics: a survey of commercial monoclonal antibodies. MAbs 1, 254–267 - PMC - PubMed

Publication types

MeSH terms

Substances

LinkOut - more resources