. 2014 Jul 11;289(28):19279-93.
doi: 10.1074/jbc.M114.570044. Epub 2014 May 29.

Hypoxia-inducible lipid droplet-associated (HILPDA) is a novel peroxisome proliferator-activated receptor (PPAR) target involved in hepatic triglyceride secretion

Affiliations

Hypoxia-inducible lipid droplet-associated (HILPDA) is a novel peroxisome proliferator-activated receptor (PPAR) target involved in hepatic triglyceride secretion

Frits Mattijssen et al. J Biol Chem. .

Abstract

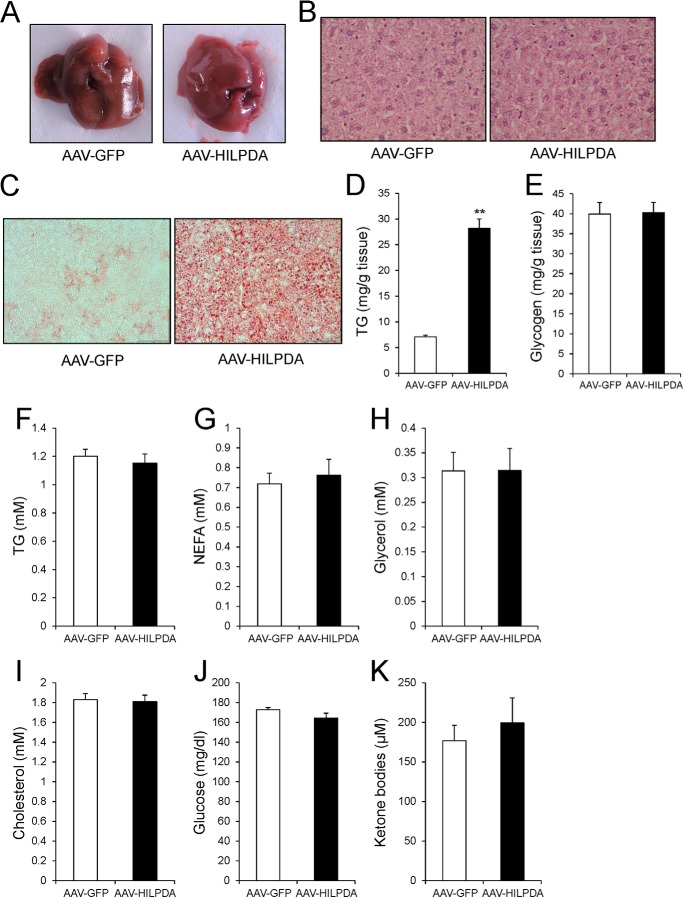
Peroxisome proliferator-activated receptors (PPARs) play major roles in the regulation of hepatic lipid metabolism through the control of numerous genes involved in processes such as lipid uptake and fatty acid oxidation. Here we identify hypoxia-inducible lipid droplet-associated (Hilpda/Hig2) as a novel PPAR target gene and demonstrate its involvement in hepatic lipid metabolism. Microarray analysis revealed that Hilpda is one of the most highly induced genes by the PPARα agonist Wy14643 in mouse precision cut liver slices. Induction of Hilpda mRNA by Wy14643 was confirmed in mouse and human hepatocytes. Oral dosing with Wy14643 similarly induced Hilpda mRNA levels in livers of wild-type mice but not Ppara(-/-) mice. Transactivation studies and chromatin immunoprecipitation showed that Hilpda is a direct PPARα target gene via a conserved PPAR response element located 1200 base pairs upstream of the transcription start site. Hepatic overexpression of HILPDA in mice via adeno-associated virus led to a 4-fold increase in liver triglyceride storage, without any changes in key genes involved in de novo lipogenesis, β-oxidation, or lipolysis. Moreover, intracellular lipase activity was not affected by HILPDA overexpression. Strikingly, HILPDA overexpression significantly impaired hepatic triglyceride secretion. Taken together, our data uncover HILPDA as a novel PPAR target that raises hepatic triglyceride storage via regulation of triglyceride secretion.

Keywords: Hig2; Lipid Droplets; Lipoprotein Secretion; Liver Metabolism; Liver Slices; Nuclear Receptor; PPRE; Peroxisome Proliferator-activated Receptor (PPAR); Steatosis; VLDL.


Figures

FIGURE 1.
FIGURE 1.
Wy14643 increases Hilpda expression in liver slices and hepatocytes. A, the top 40 most highly induced genes in mouse liver slices exposed to 20 μm Wy14643 for 24 h. Values are expressed as -fold changes over DMSO-treated slices from the same animal (n = 4). B, amino acid sequence of mouse and human HILPDA. C, Hilpda mRNA levels determined by qPCR in mouse liver slices exposed to 20 μm Wy14643 for 6 h. Samples include the four mice described in A plus two additional mice (n = 6). Shown are Hilpda mRNA levels in mouse hepatocytes (D, n = 6 animals from different strains) and human hepatocytes (E, n = 6) after exposure to Wy14643 (10 and 50 μm, respectively) for 6 h. F, Hilpda mRNA levels in primary hepatocytes of wild-type and Ppara−/− mice incubated with Wy14643 (10 μm) for 24 h. G, Hilpda mRNA levels in rat hepatocytes incubated with various nuclear receptor ligands for 24 h (RXR agonist LG1069, 1 μm; Wy14643, 5 μm; Fenofibrate, 50 μm; LXR agonist T0901317, 1 μm; FXR agonist chenodeoxycholic acid, 50 μm). H, Hilpda mRNA levels in rat FAO hepatoma cells incubated with Wy14643 (10 μm) for various times. Wy14643 was removed after 4 h of incubation. Data are mean ± S.E. (error bars). Asterisks, significant differences according to Student's t test: *, p < 0.05; **, p < 0.01.
FIGURE 2.
FIGURE 2.
PPAR-dependent regulation of Hilpda expression in vivo. Hilpda gene expression (A, n = 4–5/group) and Western blot (B) analysis of livers from wild-type and Ppara−/− mice fed chow containing 0 or 0.1% Wy14643 for 5 days. Hilpda gene expression (C, n = 4–5/group) and Western blot (D) analysis of livers from fed and 24-h fasted wild-type and Ppara−/− mice. E, analysis of Plin4 and Acacb mRNA levels (E) and Pparg mRNA levels (F) in livers from fed and 24-h fasted wild-type and Ppara−/− mice (n = 4–5/group). G, Hilpda mRNA levels in livers from Ppara−/− mice intravenously injected with adenovirus encoding LacZ or Pparg1 (n = 4/group). Data are mean ± S.E. (error bars). Two-way analysis of variance with Bonferroni post hoc test (A, C, E, and F) or Student's t test (G) was performed. *, p < 0.05; **, p < 0.01; ##, p < 0.01. *, difference between WT and Ppara−/− (A, C, E, and F); #, difference between control/Wy14643 (A) or fed/fasted (C, E, and F).
FIGURE 3.
FIGURE 3.
PPAR mediated regulation of Hilpda expression is mediated by a PPRE 1200 bp upstream of the transcription start site. A, sequence of the human and mouse PPRE located 1200 bp upstream of the TSS of Hilpda. Three adenine residues were mutated to cytosine to serve as negative controls. B–D, HepG2 cells were transfected with luciferase reporter constructs containing wild-type or mutant mouse (B–D) or human (E) PPRE together with empty vector or PPAR/RXRα expression vectors as indicated. All conditions contain equal amounts of DNA, and β-galactosidase was co-transfected for normalization. Transfected cells were subsequently exposed to DMSO, 50 μm Wy14643, 5 μm GW501516, or 5 μm rosiglitazone for 24 h. Luciferase readings in cell lysates were normalized against β-galactosidase activity (n = 3). F, chromatin was extracted from wild-type and Ppara−/− primary hepatocytes, and a ChIP assay was performed using antibodies specific for PPARα or IgG. PCR was performed using primers flanking the conserved PPRE 1200 bp upstream of the Hilpda TSS or negative control primers to amplify an intergenic region 100 kb upstream of Pdk4 (n = 3). Data are mean ± S.E. (error bars). *, significant difference according to Student's t test (p < 0.01).
FIGURE 4.
FIGURE 4.
Hepatic overexpression of HILPDA does not impact body weight. A, fluorescent microscopy of liver sections from AAV-GFP and AAV-HILPDA mice 4 weeks postinjection of the corresponding AAVs. B, HILPDA protein expression in livers from AAV-GFP and AAV-HILPDA animals. HSP90 served as a loading control. C, Western blot analysis of endogenous and overexpressed HILPDA. For endogenous protein an aliquot of a sample used in Fig. 2B (wild-type animal fed a diet supplemented with Wy14643) was loaded. D, HILPDA Western blot on plasma samples of animals injected with 1–5 × 10¹¹ genomic copies of AAV-HILPDA. An aliquot of diluted liver lysate from an animal injected with 2.5 × 10¹¹ genomic copies of AAV-HILPDA virus was used as a positive control. Ponceau S staining is shown to illustrate the presence of plasma proteins. E, body weight of AAV-GFP and AAV-HILPDA animals 4 weeks after injection of corresponding AAVs (n = 10–13 animals/group). F–H, liver (F), epididymal white adipose tissue (eWAT) (G), and brown adipose tissue (BAT) (H) weight of AAV-GFP and AAV-HILPDA animals (n = 8 animals/group). I and J, fat mass (I) and lean mass (J) in AAV-GFP and AAV-HILPDA animals determined using EchoMRI (n = 10–13 animals/group). Data are mean ± S.E. (error bars).
FIGURE 5.
FIGURE 5.
AAV-mediated HILPDA overexpression induces hepatic steatosis. A, gross morphology of livers from AAV-GFP and AAV-HILPDA animals 4 weeks after injection of viruses. Animals were sacrificed under fed conditions. B, representative H&E staining of livers from AAV-GFP and AAV-HILPDA animals. C, Oil Red O staining of liver sections from AAV-GFP and AAV-HILPDA animals. D, hepatic TG content determined 4 weeks postinjection of AAVs (n = 8 animals/group). E, hepatic glycogen levels in AAV-GFP and AAV-HILPDA animals (n = 8 animals/group). F–K, plasma TG (F), NEFA (G), glycerol (H), cholesterol (I), glucose (J), and ketone body (K) levels in AAV-GFP and AAV-HILPDA animals 4 weeks postinjection of respective viruses (n = 7–8 animals/group). Data are mean ± S.E. (error bars). Asterisks, significant difference according to Student's t test (**, p < 0.01).
FIGURE 6.
FIGURE 6.
Hepatic overexpression of HILPDA does not affect the expression of key genes involved in β-oxidation or de novo lipogenesis. A, qPCR analysis of important genes related to β-oxidation, lipogenesis, hepatic lipid uptake, and VLDL production in livers of AAV-GFP and AAV-HILPDA animals (n = 7–8 animals/group). B, scatter plot of the logarithmic expression signal of 1575 genes left after the set filter criteria (see “Experimental Procedures”). Average expression signal of each gene in the GFP group is plotted on the x axis, and expression in the HILPDA group is plotted on the y axis (n = 2 arrays/group). C, volcano plot displaying the fold induction of 1575 genes (x axis) related to their significance level (y axis) upon HILPDA overexpression. Genes that met the inclusion criteria (see “Experimental Procedures”) were included in the analysis. Arrow, Gadd45g. Data are mean ± S.E. (error bars).
FIGURE 7.
FIGURE 7.
AAV-HILPDA animals secrete less triglyceride. A, total TG hydrolyase activity in liver samples from AAV-GFP and AAV-HILPDA animals (n = 8 animals/group). B, mouse ATGL or HSL was overexpressed in COS-7 cells, and lysates were assayed for hydrolase activity in the presence of COS-7 lysates from cells transfected with expression vectors for LacZ or HILPDA (n = 2). C, plasma TG levels after intravenous administration of tyloxapol to determine hepatic TG secretion in 16-h fasted AAV-GFP and AAV-HILPDA animals (n = 7 animals/group). D and E, lipoprotein-associated TG (D) and cholesterol (E) levels in HPLC fractions of pooled plasma samples from AAV-GFP and AAV-HILPDA animals. F–H, Hilpda mRNA (F) and protein levels (G) in wild-type animals after a 16-week HFD intervention resulting in the development of hepatic steatosis (H) (n = 8–10 animals/group). Data are mean ± S.E. (error bars). Asterisks, significant differences according to Student's t test (**, p < 0.01).

Similar articles

Cited by

References

    1. McPherson P. A., McEneny J. (2012) The biochemistry of ketogenesis and its role in weight management, neurological disease and oxidative stress. J. Physiol. Biochem. 68, 141–151 - PubMed
    1. Sun Z., Lazar M. A. (2013) Dissociating fatty liver and diabetes. Trends Endocrinol. Metab. 24, 4–12 - PMC - PubMed
    1. Pawlak M., Lefebvre P., Staels B. (2012) General molecular biology and architecture of nuclear receptors. Curr. Top. Med. Chem. 12, 486–504 - PMC - PubMed
    1. Nakamura M. T., Cheon Y., Li Y., Nara T. Y. (2004) Mechanisms of regulation of gene expression by fatty acids. Lipids 39, 1077–1083 - PubMed
    1. Chawla A., Repa J. J., Evans R. M., Mangelsdorf D. J. (2001) Nuclear receptors and lipid physiology: opening the X-files. Science 294, 1866–1870 - PubMed

Publication types

MeSH terms