. 2014 May 29;3(6):529-41.
doi: 10.1242/bio.20147732.

Inward cholesterol gradient of the membrane system in P. falciparum-infected erythrocytes involves a dilution effect from parasite-produced lipids

Affiliations

Inward cholesterol gradient of the membrane system in P. falciparum-infected erythrocytes involves a dilution effect from parasite-produced lipids

Fuyuki Tokumasu et al. Biol Open. .

Abstract

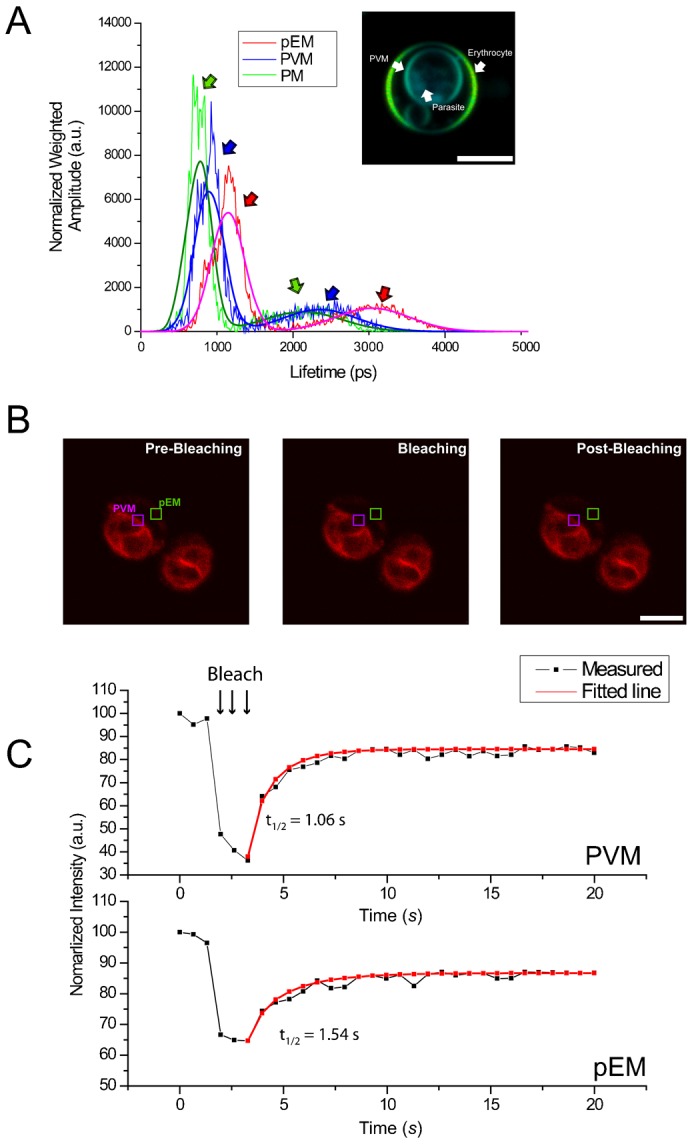
Plasmodium falciparum (Pf) infection remodels the human erythrocyte with new membrane systems, including a modified host erythrocyte membrane (EM), a parasitophorous vacuole membrane (PVM), a tubulovesicular network (TVN), and Maurer's clefts (MC). Here we report on the relative cholesterol contents of these membranes in parasitized normal (HbAA) and hemoglobin S-containing (HbAS, HbAS) erythrocytes. Results from fluorescence lifetime imaging microscopy (FLIM) experiments with a cholesterol-sensitive fluorophore show that membrane cholesterol levels in parasitized erythrocytes (pRBC) decrease inwardly from the EM, to the MC/TVN, to the PVM, and finally to the parasite membrane (PM). Cholesterol depletion of pRBC by methyl-β-cyclodextrin treatment caused a collapse of this gradient. Lipid and cholesterol exchange data suggest that the cholesterol gradient involves a dilution effect from non-sterol lipids produced by the parasite. FLIM signals from the PVM or PM showed little or no difference between parasitized HbAA vs HbS-containing erythrocytes that differed in lipid content, suggesting that malaria parasites may regulate the cholesterol contents of the PVM and PM independently of levels in the host cell membrane. Cholesterol levels may affect raft structures and the membrane trafficking and sorting functions that support Pf survival in HbAA, HbAS and HbSS erythrocytes.

Keywords: Detergent-resistant membrane domain; Fluorescence lifetime imaging microscopy; Malaria; Maurer's cleft; Membrane rafts; Parasitophorous vacuole membrane; Plasmodium falciparum.


Conflict of interest statement

Competing interests: The authors have no competing interests to declare.

Figures

Fig. 1.
Fig. 1.. Fluorescence signals and fluorescence lifetime microscopy (FLIM) results from non-parasitized and pRBC.
(A) Images and FLIM color maps of Di-4 labeled non-parasitized and pRBC. FLIM images are artificially colored from blue (500 ps) to orange (3000 ps) to display the differences and heterogeneities of fluorescence lifetimes in the membranes of the host erythrocyte, MC/TVN, PVM and parasite. (B) Regions from color lifetime maps of Di-4 ANEPPDHQ (Di-4)-labeled pRBC selected and exported for statistical analyses. PVM was carefully determined by overlaying DIC and lifetime maps. (C) Lifetime distributions from the pixel values from the membranes of a ring stage-infected erythrocyte. Each distribution was fitted with Gaussian curve to assess lifetime distributions. Fitting errors are less than 2 ps. (D) Distributions of average Di-4 lifetime values from the host membrane and PVM of ring stage-infected erythrocytes (3 independent experiments, total 29 cells analyzed). (E) Lifetime distributions from the pixel values from the membranes of a trophozoite stage-infected erythrocyte. (F) Distributions of average Di-4 lifetime values from the host and parasite membranes of trophozoite stage-infected erythrocytes. Lifetime distributions from the membranes of the host erythrocyte, PVM, and PM are statistically different (4 independent experiments, total 13 cells analyzed). (G) Distributions of differences between the average Di-4 lifetimes from membranes of the pRBC analyzed for panel F. DIC, differential interference contrast micrograph. Scale bars: 5 µm.
Fig. 2.
Fig. 2.. Fluorescence lifetime microscopy (FLIM) results from MC/TVN and PVM extensions (dotted lines) compared with the FLIM results from membranes of the host erythrocyte and PVM.
(A) Color lifetime maps. (B) Histogram of lifetime distributions from host erythrocyte, PVM, and MC/TVN. (C) Distributions of average results and differences from the analysis of individual pRBC. Signals from MC/TVN were analyzed from a total 13 pRBC in 4 independent experiments. Scale bars: 5 µm.
Fig. 3.
Fig. 3.. Effect of cholesterol removal on Di-4 ANEPPDHQ (Di-4) fluorescence lifetimes from the membranes of pRBC.
(A) Images and color lifetime maps of untreated and methyl-β-cyclodextrin (MβCD)-treated pRBC. Cholesterol removal by MβCD causes a significant reduction of fluorescence lifetime that cannot be detected by regular confocal microscopy. We determined the MβCD concentration based on preliminary titration experiments. At this MβCD concentration, we did not observe any cell lysis due to the reduction of membrane cholesterol. (B) Histograms of the average lifetime values from an individual pRBC. (C) Distributions of the average lifetime values from the membranes of untreated and MβCD-treated pRBC (3 independent experiments, total 16 cells analyzed). Cholesterol removal greatly reduces the lifetime differences between the membranes of the host cell, PVM and parasite. (D) Table of Di-4 lifetimes and their differences from pRBC after treatment with MβCD (3 independent experiments, total 16 cells analyzed). Scale bars: 5 µm.
Fig. 4.
Fig. 4.. Fluorescence lifetime microscopy (FLIM) component analysis and fluorescence recovery after laser bleaching.
(A) Each pixel value of fluorescence lifetime was decomposed into two components (fast and slow decay) with weighing values. Results of this mathematical decomposition are fit two Gaussian curves. (B,C) Bleached regions of pRBC (1.2 µm×1.2 µm). Images of the areas before, during and after bleaching are indicated by the boxes. (C) Fluorescence recovery curves. Three pre-bleaching, 3 bleaching and 25 post-bleaching frames were recorded (3 independent experiments, total 8 cells analyzed). Fluorescence recovered more rapidly from the parasitophorous vacuole membrane (PVM) than from the parasitized erythrocyte membrane (pEM). pEM, parasitized EM; PM, parasite membrane. Scale bars: 5 µm.
Fig. 5.
Fig. 5.. Di-4 ANEPPDHQ (Di-4) lifetime comparisons of non-parasitized and P. falciparum (Pf)-parasitized HbAA, HbAS, and HbSS erythrocytes.
All comparisons were performed in parallel with fresh erythrocytes to exclude potential effects of blood aging or culture conditions. (A) Color lifetime maps of non-parasitized and Pf-parasitized HbAA, HbAS and HbSS erythrocytes. Yellow: pEM; white: nEM. (B) Distributions of lifetime values collected from experiments with four separate sample sets from different donors of HbAA, HbAS and HbSS erythrocytes. Eight cells of each blood type were analyzed in each experiment to obtain average values of lifetime. Each average lifetime value was normalized to the average lifetime from non-parasitized AA erythrocytes to compensate for experimental variation from culture conditions and microscope calibrations. (C) Color lifetime maps of methyl-β-cyclodextrin (MβCD)-treated non-parasitized and Pf-parasitized HbAA, HbAS, and HbSS erythrocytes. (D) Distributions of fluorescence lifetimes from the membranes of Pf-parasitized HbAA, HbAS and HbSS erythrocytes before (black) and after (red) MβCD treatment (n = 6 for each blood type). (E) Differences between the average Di-4 lifetimes from the membranes before and after MβCD treatment. Scale bars: 5 µm.
Fig. 6.
Fig. 6.. Lipid probe translocation from the host cell membrane to membranes of the parasitophorous vacuole and parasite in Plasmodium falciparum-infected erythrocytes.
(A) Fluorophore stability test. Non-parasitized erythrocytes were labeled with Di-4 ANEPPDHQ (Di-4) and kept in culture condition for 48 hours. No structural damage by long term labeling with the fluorophore was observed from bright-field images. Epifluorescence images showed no apparent reduction in fluorescence intensity on both second and third day, verifying fluorophore stability in membrane. (B) Fluorophore translocation from labeled erythrocytes to non-labeled invading parasites. At 24 hours, the ring stage parasite and PVM are clearly labeled, while only weak fluorescence is present at the pEM. (C) Fluorophore signal from the PM and PVM indicative of continued probe translocation. (D) Fluorescence from an internal ring-stage parasite after invasion of non-labeled erythrocytes by merozoites released from labeled schizont-infected erythrocytes. No signal was observed from the host membrane of the ring stage-infected erythrocyte, suggesting that little or no translocation of the probe occurred from the PVM to the host EM. (E) Trophozoite stage parasite showing strong fluorescence from PM but little or no signal from the host erythrocyte. DIC, differential interference contrast micrograph. Scale bars: 5 µm.
Fig. 7.
Fig. 7.. Boron-dipyrromethene (Bodipy)-cholesterol translocation from the EM to the PVM.
(A) Stability test of Bodipy-cholesterol fluorescence from labeled, non-parasitized erythrocytes. No morphological changes were observed more than 48 hours after the addition of Bodipy-cholesterol. (B) Evidence for Bodipy-cholesterol transfer from the previously labeled erythrocyte to the membranes of invading non-labeled parasites. Unlike fluorescence from Di-4 ANEPPDHQ (Di-4)-labeled erythrocytes, Bodipy-cholesterol fluorescence from the host cell membrane remains readily detectable after parasitization. (C) Trophozoite stage-infected erythrocytes show Bodipy-cholesterol fluorescence from the PVM and its TVN extensions in the erythrocyte cytoplasm, but fluorescence is no longer evident at the pEM. Note also the absence of fluorescence from the interior of parasite itself. DIC, differential interference contrast micrograph. (D) Di-4 FLIM signals from non-parasitized HbAA erythrocytes incubated in 0, 10, 100% human serum for 48 hours after MβCD treatment. (E) Di-4 FLIM lifetime value distributions after each 48 hours incubation; lifetime recovery depends upon serum concentration. The number of RBC analyzed for 0, 10, and 100% serum were 38, 33, 48, respectively. (F) Images showing PVM sizes of ring (left) and trophozoite (right) stages in pRBC. Scale bars: 5 µm.
Fig. 8.
Fig. 8.. Model for cholesterol gradient development in the pRBC.
The initial, early ring-stage PVM formed during parasite invasion has the same cholesterol level as the pEM. The growing parasite synthesizes and supplies large amounts of phospholipids to the PVM, accommodating the size increase of the PVM and diluting its cholesterol concentration. Cytostome formation to internalize host hemoglobin may deliver PVM cholesterol into parasite. Some cholesterol may also be transferred from the pEM to the PVM through the physical contacts between pEM and intracellular membrane system including MC and the TVN. Vesicles associated with the TVN and MC may contribute to cholesterol delivery. Serum cholesterol may also transfer to membrane systems of the intraerythrocytic parasite by exosomes involved in cell-to-cell communication or by direct physical connections with the host cell membrane.

Similar articles

Cited by

References

    1. Aikawa M. (1988). Morphological changes in erythrocytes induced by malarial parasites. Biol. Cell 64, 173–181. - PubMed
    1. Aikawa M., Hepler P. K., Huff C. G., Sprinz H. (1966). The feeding mechanism of avian malarial parasites. J. Cell Biol. 28, 355–373 10.1083/jcb.28.2.355 - DOI - PMC - PubMed
    1. Aikawa M., Miller L. H., Johnson J., Rabbege J. (1978). Erythrocyte entry by malarial parasites. A moving junction between erythrocyte and parasite. J. Cell Biol. 77, 72–82 10.1083/jcb.77.1.72 - DOI - PMC - PubMed
    1. Aikawa M., Miller L. H., Rabbege J. R., Epstein N. (1981). Freeze-fracture study on the erythrocyte membrane during malarial parasite invasion. J. Cell Biol. 91, 55–62 10.1083/jcb.91.1.55 - DOI - PMC - PubMed
    1. Aikawa M., Uni Y., Andrutis A. T., Howard R. J. (1986). Membrane-associated electron-dense material of the asexual stages of Plasmodium falciparum: evidence for movement from the intracellular parasite to the erythrocyte membrane. Am. J. Trop. Med. Hyg. 35, 30–36. - PubMed

LinkOut - more resources