Comparative Study
. 2014 Jul;8(4):699-708.
doi: 10.1177/1932296814532203. Epub 2014 Apr 21.

A comparative effectiveness analysis of three continuous glucose monitors: the Navigator, G4 Platinum, and Enlite

Affiliations
Comparative Study

A comparative effectiveness analysis of three continuous glucose monitors: the Navigator, G4 Platinum, and Enlite

Edward R Damiano et al. J Diabetes Sci Technol. 2014 Jul.

Abstract

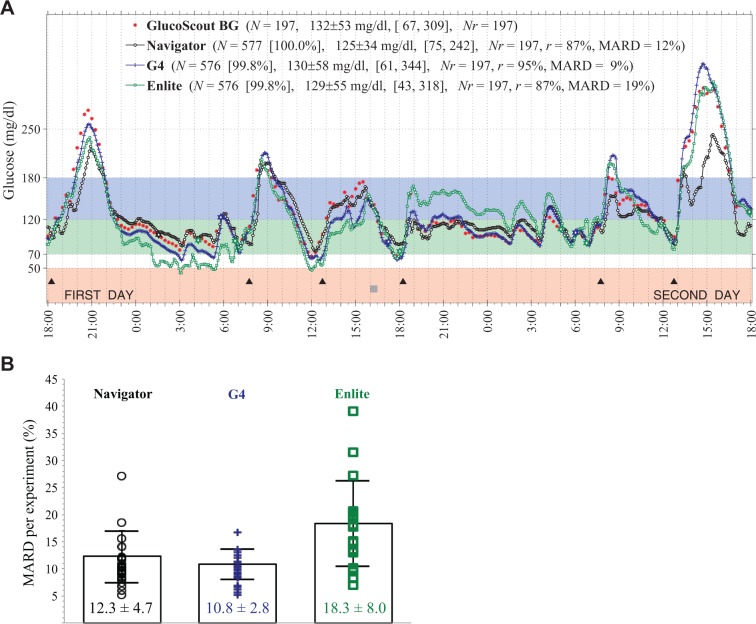
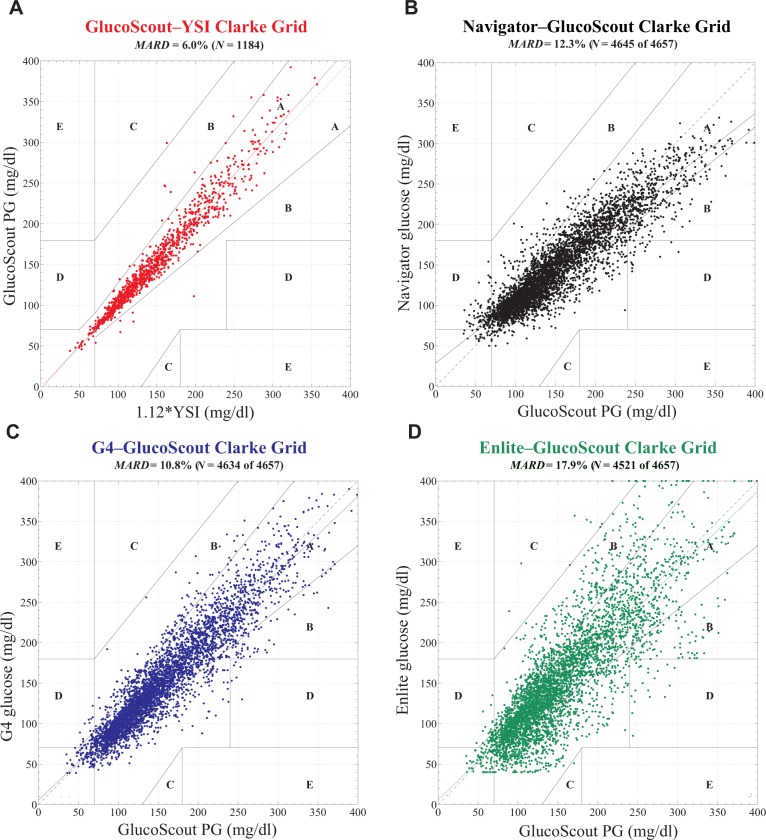
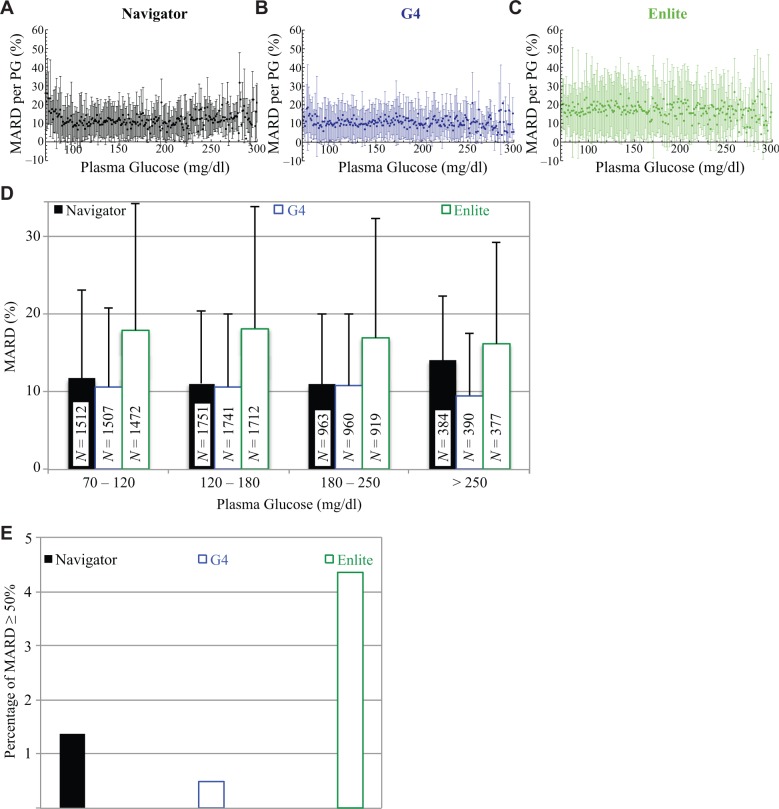
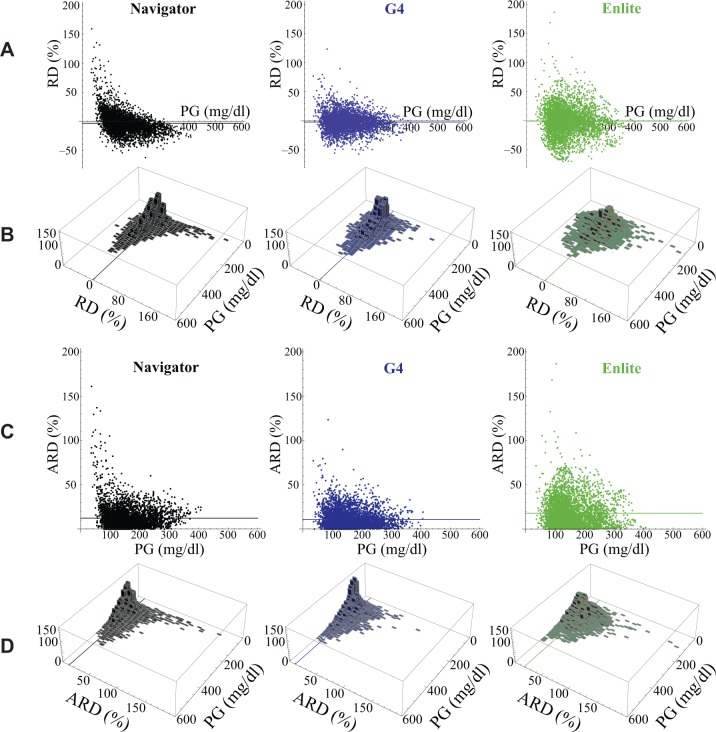
The effectiveness and safety of continuous glucose monitors (CGMs) is dependent on their accuracy and reliability. The objective of this study was to compare 3 CGMs in adult and pediatric subjects with type 1 diabetes under closed-loop blood-glucose (BG) control. Twenty-four subjects (12 adults) with type 1 diabetes each participated in one 48-hour closed-loop BG control experiment. Venous plasma glucose (PG) measurements obtained every 15 minutes (4657 values) were paired in time with corresponding CGM glucose (CGMG) measurements obtained from 3 CGMs (FreeStyle Navigator, Abbott Diabetes Care; G4 Platinum, Dexcom; Enlite, Medtronic) worn simultaneously by each subject. The Navigator and G4 Platinum (G4) had the best overall accuracy, with an aggregate mean absolute relative difference (MARD) of all paired points of 12.3 ± 12.1% and 10.8 ± 9.9%, respectively. Both had lower MARDs of all paired points than Enlite (17.9 ± 15.8%, P < .005). Very large errors (MARD > 50%) were less common with the G4 (0.5%) than with the Enlite (4.3%, P = .0001) while the number of very large errors with the Navigator (1.4%) was intermediate between the G4 and Enlite (P = .1 and P = .06, respectively). The average MARD for experiments in adolescent subjects were lower than in adult subjects for the Navigator and G4, while there was no difference for Enlite. All 3 devices had similar reliability. A comprehensive head-to-head-to-head comparison of 3 CGMs revealed marked differences in both accuracy and precision. The Navigator and G4 were found to outperform the Enlite in these areas.

Keywords: CGM; accuracy; blood glucose; blood glucose meter; continuous glucose monitoring; reliability.


Conflict of interest statement

Declaration of Conflicting Interests: The author(s) declared the following potential conflicts of interest with respect to the research, authorship, and/or publication of this article: Abbott Diabetes Care, Dexcom, and International Biomedical loaned equipment for this study and provided technical support for its use. Abbott, Dexcom, and Medtronic provided sensors for this study. Medtronic processed data from the Enlite sensor with the Veo/530G algorithm. SJR received travel expenses and an honoraium from Abbott Diabetes Care for a lecture, grant support for an investigator initiated study from Abbott Diabetes Care, and consulting fees from Medtronic.

Figures

Figure 1.
Figure 1.
(A) Representative results from 1 of twenty-four 48-hour closed-loop BG control experiments in 1 of 24 subjects showing venous PG concentrations measured every 15 minutes with the GlucoScout (red symbols) and CGMG values measured approximately every 5 minutes with the Navigator (black symbols), G4 (blue symbols), and Enlite (green symbols). The timing of 6 meals is indicated by black triangles. One period of structured exercise at 16:00 (2 hours before the fourth meal) is indicated by a gray square. Listed in the legend for each CGM is the number, N, of glucose values measured, the data reporting percentage (in square brackets), and the MARD averaged over the 48-hour period (based on 193 paired PG–CGMG values for each CGM). Results shown in (A) for each experiment are shown in Supplemental Figures 1 to 24. The 48-hour MARDs computed in each of the 24 experiments are shown in (B) for each sensor with the mean and SD of each of those MARDs superimposed on the data for each device.
Figure 2.
Figure 2.
Clarke error grid analyses of (A) venous plasma glucose (PG) measured by the GlucoScout with venous blood glucose (BG) measured by the YSI designated as the reference, and CGMG measured by (B) the Navigator, (C) the G4, and (D) the Enlite with venous PG measured by the GlucoScout designated as the reference. (A) Based on a total of N = 1184 GlucoScout–YSI glucose pairs, 98.6% of points fell in zone A, 1.3% in zone B, 0.1% in zone C, and 0% in zone D. The slope and intercept of the linear least squares fit to these data (solid red line) were 1.05 and −3 mg/dl, respectively. The MARD was found to be 6.0% between GlucoScout PG and YSI BG (after converting the latter to PG with a multiplicative factor of 1.12). (B) Based on a total of N = 4645 Navigator–GlucoScout pairs, the Navigator achieved 84.2% of points in zone A, 14.2% in zone B, 0% in zone C, and 1.6% in zone D. The slope and intercept of the linear least squares fit to these data (solid black line) were 0.77 and 29 mg/dl, respectively. The Navigator achieved an overall data reporting percentage of 99.7% and a MARD of 12.3 ± 12.1%. (C) Based on a total of N = 4634 G4–GlucoScout pairs, the G4 achieved 84.5% of points in zone A, 15.1% in zone B, 0% in zone C, and 0.5% in zone D. The slope and intercept of the linear least squares fit to these data (solid blue line) were 0.94 and 5 mg/dl, respectively. The G4 achieved an overall data reporting percentage of 99.5% and a MARD of 10.8 ± 9.9%. (D) Based on a total of N = 4521 Enlite–GlucoScout pairs, the Enlite achieved 69.1% of points in zone A, 29.8% in zone B, 0.3% in zone C, and 0.8% in zone D. The slope and intercept of the linear least squares fit to these data (solid green line) were 0.95 and 6 mg/dl, respectively. The Enlite achieved an overall data reporting percentage of 97.1% and a MARD of 17.9 ± 15.8%.
Figure 3.
Figure 3.
(A)-(C) The MARD and SD in the MARD corresponding to each PG value from 70 to 320 mg/dl for the Navigator, G4, and Enlite, respectively. Data points without error bars represent sole values for that particular PG value. (D) The MARD and SD in the MARD corresponding to the clinically relevant PG ranges from 70 to 120, 120 to 180, 180 to 250, and ≥250 mg/dl for the Navigator, G4, and Enlite. The number, N, of data in each PG range is shown in the corresponding bar for each device. For PG values in the normoglycemic range, from 70 to 120 mg/dl, the MARDs were found to be 11.7 ± 11.4% (N = 1512), 10.7 ± 10.2% (N = 1507), and 17.9 ± 16.9% (N = 1472), for the Navigator, G4, and Enlite, respectively. Somewhat less reliable, because of the relatively smaller sample size obtained, are the data corresponding to PG values in the moderate-to-mild hypoglycemic range from 50 to 70 mg/dl (not shown here); in this range, the MARDs were found to be 36 ± 27% (N = 101), 19 ± 17% (N = 102), and 23 ± 19% (N = 102), for the Navigator, G4, and Enlite, respectively. (E) Occurrence of MARD values ≥ 50% for each of the 3 CGMs. The G4 had the lowest occurrence of 22 events (0.5%) and was followed by the Navigator, with 64 events (1.4%), and the Enlite, with 197 events (4.4%).
Figure 4.
Figure 4.
(A) Distribution, as a function of PG, of the relative difference (RD) between each CGMG measurement and its corresponding PG value (measured with the GlucoScout) for the Navigator (black), G4 (blue), and Enlite (green). (B) Histograms in the PG–RD plane for each of the data sets shown above in (A). The horizontal line in each panel in (A) and the line in the PG–RD plane in each panel in (B) correspond to the MRD for each of the 3 data sets. (C) Distribution, as a function of PG, of the ARD between each CGMG measurement and its corresponding PG value (measured with the GlucoScout) for the Navigator (black), G4 (blue), and Enlite (green). (D) Histograms in the PG–ARD plane for each of the data sets shown above in (C). The horizontal line in each panel in (C) and the line in the PG–ARD plane in each panel in (D) correspond to the MARD for each of the 3 data sets. Note, it can be seen that the data in (C) and (D) are derivable by reflecting all negatively valued RD data that fall below the PG axis in (A) and (B) to their corresponding positive values above the PG axis.

References

    1. Damiano ER, El-Khatib FH, Zheng H, Nathan DM, Russell SJ. A comparative effectiveness analysis of three continuous glucose monitors. Diabetes Care. 2013;36(2):251-259. - PMC - PubMed
    1. Freckmann G, Pleus S, Link M, Zschornack E, Klotzer HM, Huag C. Performance evaluation of three continuous glucose monitoring systems: comparison of six sensors per subject in parallel. J Diabetes Sci Tech. 2013;7(4):842-853. - PMC - PubMed
    1. Russell SJ, El-Khatib FH, Nathan DM, Magyar KL, Jiang J, Damiano ER. Blood glucose control in type 1 diabetes with a bihormonal bionic endocrine pancreas. Diabetes Care. 2012;35(1):2148-2155. - PMC - PubMed
    1. Castle JR, Pitts A, Zheng H, et al. The accuracy benefit of multiple amperometric glucose sensors in people with type 1 diabetes. Diabetes Care. 2012;35(4):706-710. - PMC - PubMed
    1. Helton KL, Ratner BD, Wisniewski NA. Biomechanics of the sensor–tissue interface—effects of motion, pressure, and design on sensor performance and foreign body response—part II: examples and application. J Diabetes Sci Tech. 2011;5(3):647-656. - PMC - PubMed

Publication types