Review
. 2014 Jul;8(4):630-40.
doi: 10.1177/1932296814532237. Epub 2014 May 12.

Design and implementation of a web-based reporting and benchmarking center for inpatient glucometrics

Affiliations
Review

Design and implementation of a web-based reporting and benchmarking center for inpatient glucometrics

Greg Maynard et al. J Diabetes Sci Technol. 2014 Jul.

Abstract

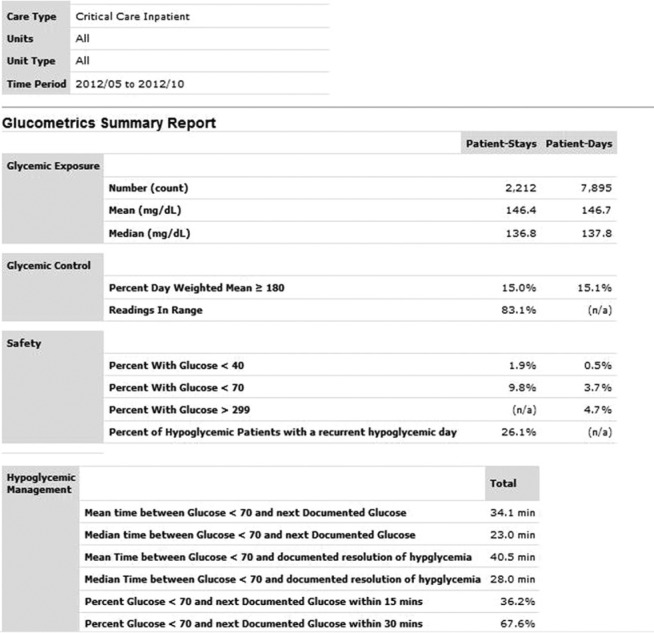
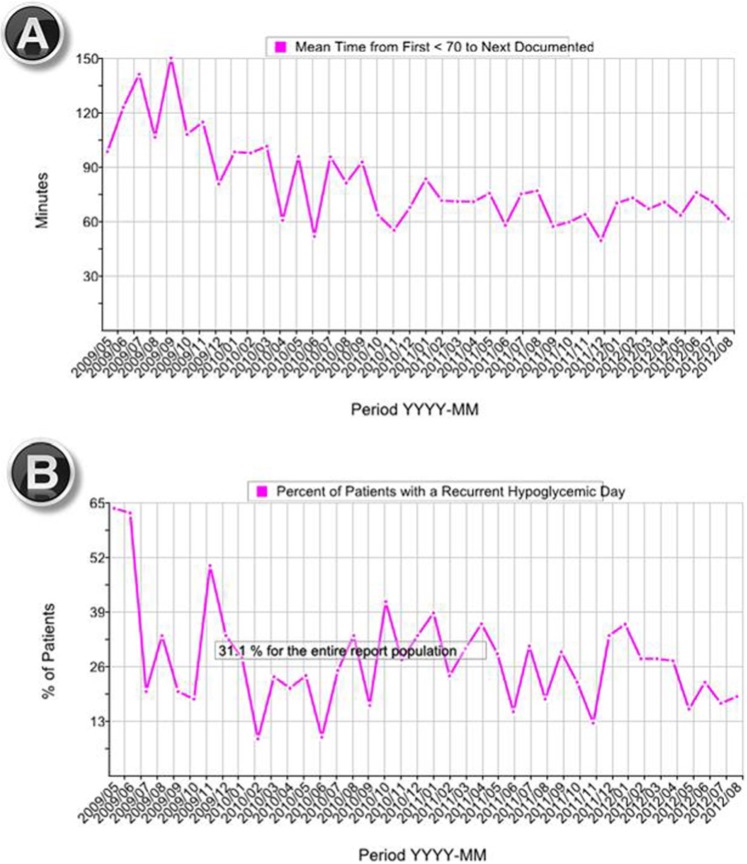
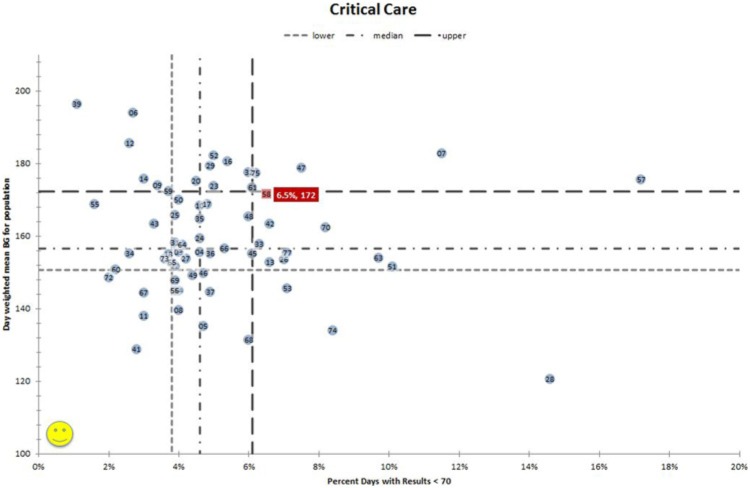
Insulin is a top source of adverse drug events in the hospital, and glycemic control is a focus of improvement efforts across the country. Yet, the majority of hospitals have no data to gauge their performance on glycemic control, hypoglycemia rates, or hypoglycemic management. Current tools to outsource glucometrics reports are limited in availability or function. Society of Hospital Medicine (SHM) faculty designed and implemented a web-based data and reporting center that calculates glucometrics on blood glucose data files securely uploaded by users. Unit labels, care type (critical care, non-critical care), and unit type (eg, medical, surgical, mixed, pediatrics) are defined on upload allowing for robust, flexible reporting. Reports for any date range, care type, unit type, or any combination of units are available on demand for review or downloading into a variety of file formats. Four reports with supporting graphics depict glycemic control, hypoglycemia, and hypoglycemia management by patient day or patient stay. Benchmarking and performance ranking reports are generated periodically for all hospitals in the database. In all, 76 hospitals have uploaded at least 12 months of data for non-critical care areas and 67 sites have uploaded critical care data. Critical care benchmarking reveals wide variability in performance. Some hospitals achieve top quartile performance in both glycemic control and hypoglycemia parameters. This new web-based glucometrics data and reporting tool allows hospitals to track their performance with a flexible reporting system, and provides them with external benchmarking. Tools like this help to establish standardized glucometrics and performance standards.

Keywords: benchmarking; blood glucose monitoring; diabetes; glycemic control; hospital; hyperglycemia; hypoglycemia; quality improvement.


Conflict of interest statement

Declaration of Conflicting Interests: The author(s) declared the following potential conflicts of interest with respect to the research, authorship, and/or publication of this article: The authors have acted as paid mentors for the Society of Hospital Medicine, a nonprofit professional society that offers the product described here for a nominal fee. They receive no personal fiscal benefit from subscribing sites.

Figures

Figure 1.
Figure 1.
Menu to construct and run glucometrics reports. The description of features corresponds to the numbers superimposed on the screen shots. (1) Four types of reports are available from this pull down menu: a tabular summary overview, patient day reports, patient stay reports, and a unique hypoglycemia management report. All but the tabular summary overview depict month by month results, as well as a summary roll up. (2) The queries can be saved for future reference, and the “run report” button executes the command once the desired parameters are in place. (3) The time frame for the report is selected from this pull down menu. Any start and end date can be chosen, or if no choice is made, data for all months available are included. For convenience, menu items like “6 months prior to latest” (as depicted here) are also available. (4) Care type options include critical care, non–critical care, and other. Users are encouraged to analyze the care types separately, as they often have different goals and interventions available. (5) Further refinement of reports can easily be constructed by restricting the query to certain unit types within a care type. For example, a query can be restricted to surgical critical care units. All units with data are also listed (only 1 unit shown here due to space restrictions). Users may select any individual unit or any combination of units for analysis.
Figure 2.
Figure 2.
Tabular overview glucometrics report. In this example, the glucometrics for all critical care units over a 6-month time period are depicted. See text for detailed descriptions of the metrics presented.
Figure 3.
Figure 3.
Hypoglycemia management run charts. (A) Decreasing time interval to documentation of a follow-up BG test after an episode of hypoglycemia (defined as a glucose < 70 mg/dL). (B) Reduction in the percentage of patients suffering from a recurrent hypoglycemic patient day in the same population. A tabular report and a run chart depicting the time interval to resolution of hypoglycemic events is generated in the same report (not shown).
Figure 4.
Figure 4.
Rank order bar chart— percentage of patient days with blood glucose results < 70 mg/dL for critical care units. Hospitals are assigned a rank order for performance, in this case for percentage of patient days with hypoglycemia. Each hospital is depicted by a vertical bar, with lower rank depicting better performance from left to right on the x-axis, and the absolute performance on the y-axis. The green horizontal line designates median performance for the cohort. The red color helps each hospital identify its own site at a glance.
Figure 5.
Figure 5.
Benchmarking scatter-plot for critical care units. Each hospital is depicted by its number and its position, defined by its performance for glycemic control (day-weighted mean glucose) on the y-axis, and hypoglycemia rates per patient day on the x-axis. Quartiles of performance are depicted by the hatched lines, with the top performers in the left lower quadrant attaining the best quartile of performance for both hyper- and hypoglycemia rates. The red color highlights an individual hospital’s performance. In this case, the highlighted hospital has relatively poor performance in both glycemic control and hypoglycemia.

References

    1. Centers for Disease Control and Prevention. Hospitalizations for Diabetes and Any-Listed Diagnosis. Available at: http://www.cdc.gov/diabetes/statistics/dmany/index.htm. Accessed December 2012.
    1. Moghissi ES, Korytkowski MT, DiNardo M, et al. American Association of Clinical Endocrinologists and American Diabetes Association consensus statement on inpatient glycemic control. Diabetes Care. 2009;32(6):1119-1131. - PMC - PubMed
    1. National Quality Forum. Safe Practices for Better Healthcare–2010 Update: A Consensus Report. Safe Practice 32: Glycemic Control. Washington, DC: NQF; 2010.
    1. Umpierrez GE, Hellman R, Korytkowski MT, et al. Management of hyperglycemia in hospitalized patients in the non-critical care setting: an endocrine society clinical practice guideline. J Clin Endocrinol Metabol. 2012;97(1):16-38. - PubMed
    1. Hellman R. A systems approach to reducing errors in insulin therapy in the inpatient setting. Endocr Pract. 2006;12(S3):49-55. - PubMed

LinkOut - more resources