Clinical Trial
. 2014 Jul;8(4):821-9.
doi: 10.1177/1932296814532326. Epub 2014 May 12.

Application of PK/PD modeling and simulation to dosing regimen optimization of high-dose human regular U-500 insulin

Affiliations
Clinical Trial

Application of PK/PD modeling and simulation to dosing regimen optimization of high-dose human regular U-500 insulin

Amparo de la Peña et al. J Diabetes Sci Technol. 2014 Jul.

Abstract

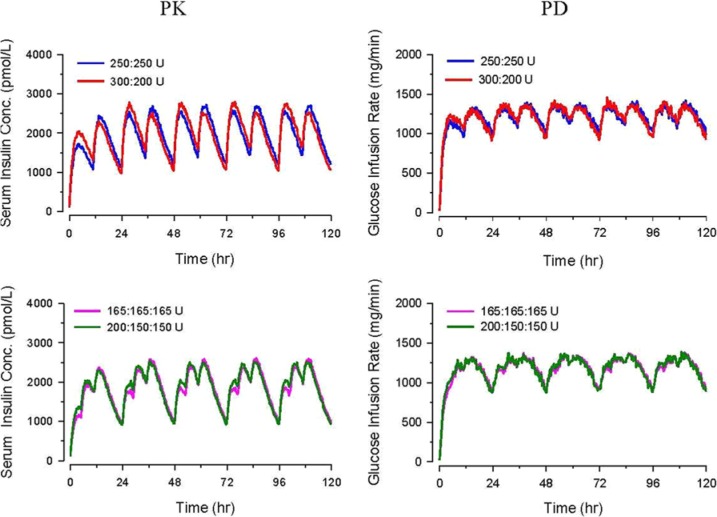
Pharmacokinetic/pharmacodynamic (PK/PD) studies of human regular U-500 insulin (U-500R) at high doses commonly used in clinical practice (>100 units) have not been performed. The current analysis applied PK/PD modeling/simulation to fit the data and simulate single-dose and steady-state PK/PD of U-500R high-dose regimens. Data from 3 single-dose euglycemic clamp studies in healthy obese and normal-weight patients, and normal-weight patients with type 1 diabetes were used to build the model. The model was sequential (PK inputs fed into PD component). PK was described using a 1-compartment model with first-order absorption and elimination. The model estimated separate absorption rate constants for U-500R and human regular U-100 insulin. The PD component used an effect compartment model, parameterized in terms of maximum pharmacologic effect (E(max)) and concentration to achieve 50% of E(max). The model described the data well. Steady-state PK for once-daily (QD), twice-daily (BID), or thrice-daily (TID) administration appeared to be reached 24 hours after the first dose. At steady-state, QD dosing showed the greatest fluctuations in PK/PD. BID dosing showed a gradual increase in insulin action with each dose and a fairly stable basal insulin effect. For TID dosing, activity was maintained throughout the dosing interval. PK/PD modeling/simulation of high U-500R doses supports BID or TID administration with an extended duration of activity relative to QD. TID dosing may provide slightly better full-day insulin effect. Additional PK/PD studies and randomized controlled trials of U-500R are needed to validate model predictions in patients with insulin-resistant diabetes requiring high-dose insulin.

Keywords: U-500 regular human insulin; dosing; modeling; pharmacodynamics; pharmacokinetics; simulation; time action profile.


Conflict of interest statement

Declaration of Conflicting Interests: The author(s) declared the following potential conflicts of interest with respect to the research, authorship, and/or publication of this article: AD, XM, SR, and JAJ are full-time employees and are minor stockholders of Eli Lilly and Company. FO received grants for research support from Eli Lilly, Bristol-Myers Squibb, AstraZeneca, Merck, Boehringer Ingelheim, NovoNordisk, Sanofi, Janssen, and GlaxoSmithKline pharmaceutical companies. In addition, FO has served in scientific advisory panels for Janssen, NovoNordisk, Sanofi, and Medtronic. FO does not own any stock in any pharmaceutical company. RMB has served on a scientific advisory board, consulted or performed clinical research with Abbott Diabetes Care, Amylin, Bayer, Becton Dickinson, Boehringer Ingelheim, Intuity, Calibra, DexCom, Eli Lilly, Halozyme, Helmsley Trust, Hygieia, Johnson & Johnson, Medtronic, Merck, the National Institute of Health, Novo Nordisk, ResMed, Roche, Sanofi, and Takeda. His employer, Park Nicollet Health Services, has contracts with the listed companies for his services and no personal income goes to RMB. RMB has inherited Merck stock, and has been a volunteer officer of the American Diabetes Association.

Figures

Figure 1.
Figure 1.
Pharmacokinetic/pharmacodynamic model. PK component: 1-compartment model with first-order absorption and different Ka for U-500R and U-100R, proportional error structure, covariates: dose identified as a significant covariate contributing to interindividual variability of Ka and Clearance; and weight identified as significant for Vd. Sequential model: Pharmacokinetics fixed inputs into pharmacodynamic model. PD component: Effect compartment model with Emax; proportional error structure, covariates: BMI identified as a significant covariate contributing to interindividual variability of Emax. Abbreviations: Ce, concentration in effect compartment; Cs, serum insulin concentration; Ka1, absorption rate constant for U-100R; Ka2, absorption rate constant for U-500R; K20, elimination rate constant from the central (serum) compartment; K23 and K32, distribution rate constants between the serum and effect compartments; SC, subcutaneous.
Figure 2.
Figure 2.
Pharmacokinetic/pharmacodynamic model goodness of fit for U-500R and U-100R, 50 U and 100 U doses. The orange line and shaded area represent the model-estimated median and 90th prediction interval respectively; the solid circles represent individual data points.
Figure 3.
Figure 3.
Pharmacokinetic/pharmacodynamic modeling of single (QD) daily doses of U-500R: 165 U, 250 U, 500 U, 750 U. The hatched area represents the 90th prediction interval from the model; the thicker line represents the median.
Figure 4.
Figure 4.
Pharmacokinetic/pharmacodynamic modeling of U-500R doses at steady-state: 500 U QD, 250 U BID, 165 U TID. QD doses were administered at 7 am, BID doses at 7 am and 6 pm, and TID doses at 7 am, 12 noon, and 6 pm. The hatched area represents the 90th prediction interval from the model; the thicker line represents the median.
Figure 5.
Figure 5.
Pharmacokinetic/pharmacodynamic modeling of U-500R doses at steady-state during 24 hours of Day 5: 500 U QD, 250 U BID, 165 U TID. Arrows represent dose administration times: for QD at 7 am, BID at 7 am and 6 pm, and TID at 7 am, 12 noon, and 6 pm.
Figure 6.
Figure 6.
Pharmacokinetic/pharmacodynamic modeling of U-500R insulin at steady state: varied proportion dosing (BID doses at 7 am and 6 pm, and TID doses at 7 am, 12 noon, and 6 pm).

References

    1. Humulin R® U-500 [product label]. Indianapolis, IN: Eli Lilly and Company; 2013.
    1. Reutrakul S, Wroblewski K, Brown RL. Clinical use of U-500 regular insulin: review and meta-analysis. J Diabetes Sci Technol. 2012;6:412-20. - PMC - PubMed
    1. NIH Clinical Trials Study Record Detail. U.S. National Institutes of Health website. Available at: http://clinicaltrials.gov/ct2/show/NCT01774968. NLM Identifier: NCT01774968. Accessed July 21, 2013.
    1. IMS Health National Prescription Audit Monthly, January 2007-August 2010. Data on file. Indianapolis, IN: Eli Lilly and Company.
    1. Galloway JA, Spradlin CT, Nelson RL, Wentworth SM, Davidson JA, Swarner JL. Factors influencing the absorption, serum insulin concentration, and blood glucose responses after injections of regular insulin and various insulin mixtures. Diabetes Care. 1981;4:366-376. - PubMed

Publication types

MeSH terms