. 2014 Mar;8(2):307-320.
doi: 10.1177/1932296814523881. Epub 2014 Mar 13.

Design of the Glucose Rate Increase Detector: A Meal Detection Module for the Health Monitoring System

Affiliations

Design of the Glucose Rate Increase Detector: A Meal Detection Module for the Health Monitoring System

Rebecca A Harvey et al. J Diabetes Sci Technol. 2014 Mar.

Abstract

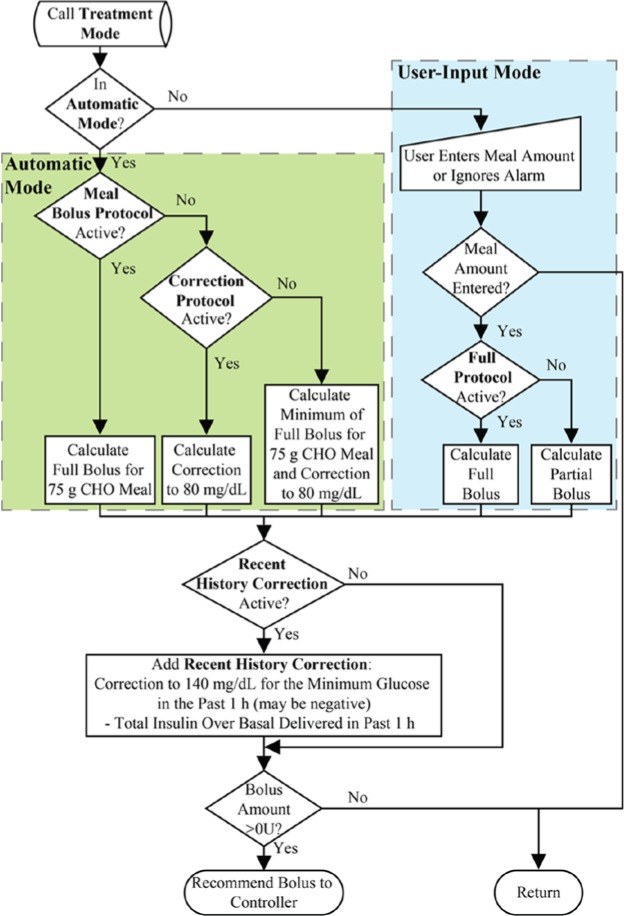
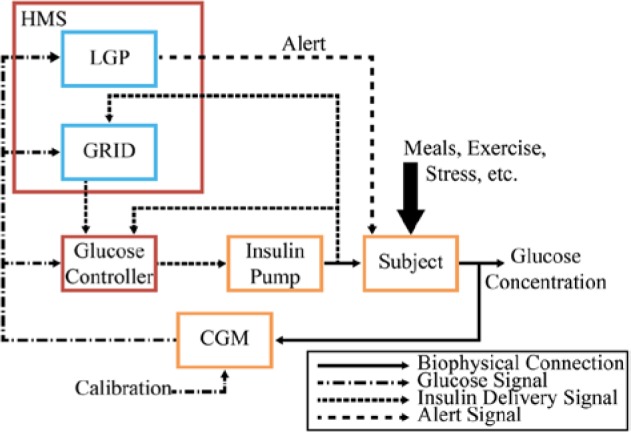
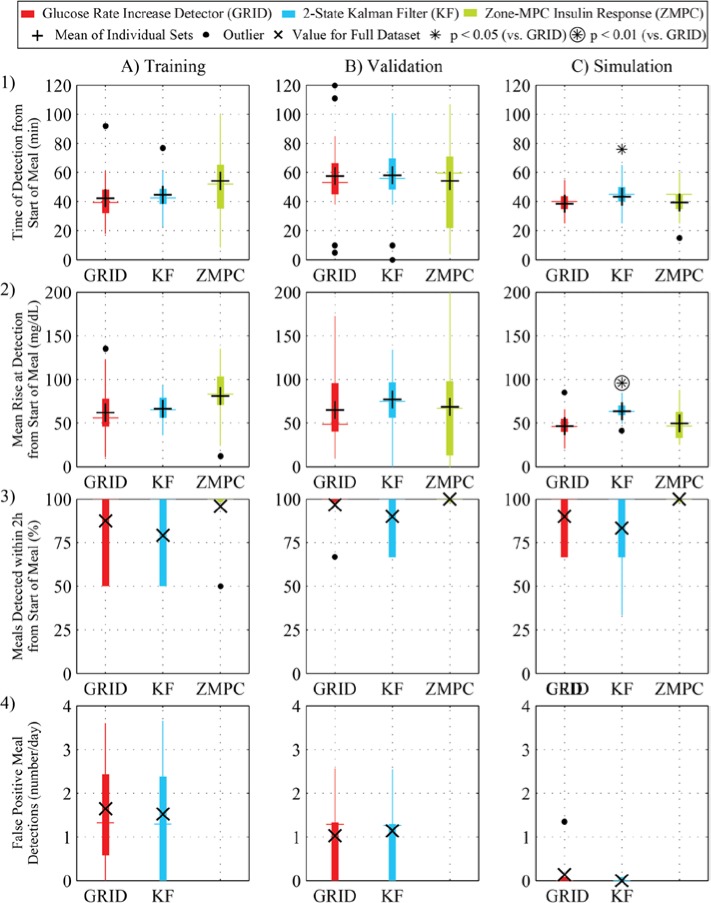
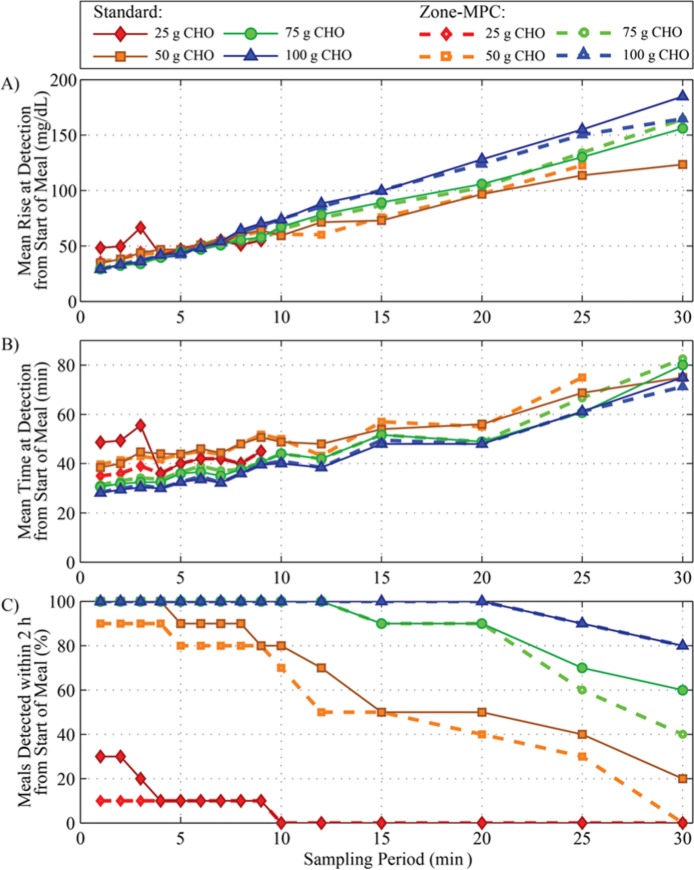
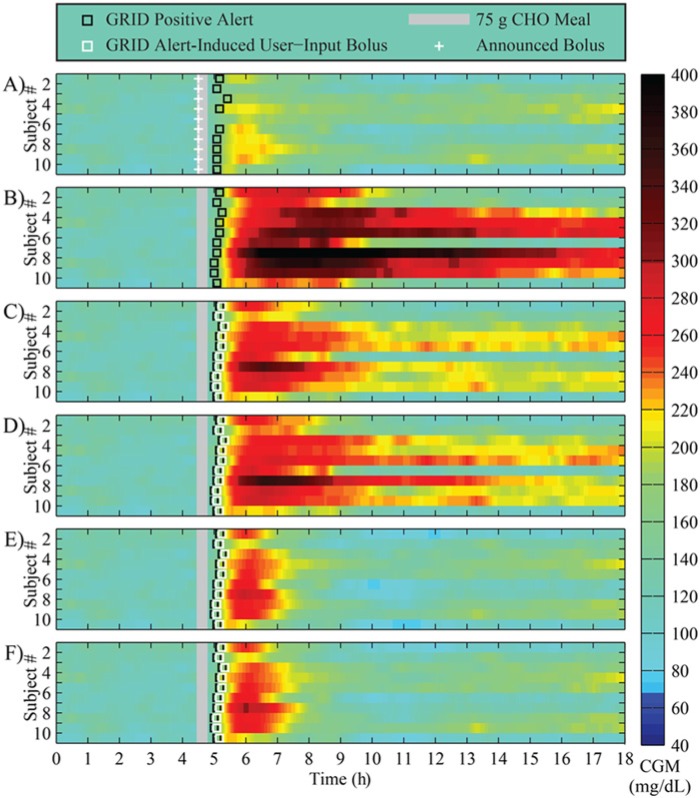
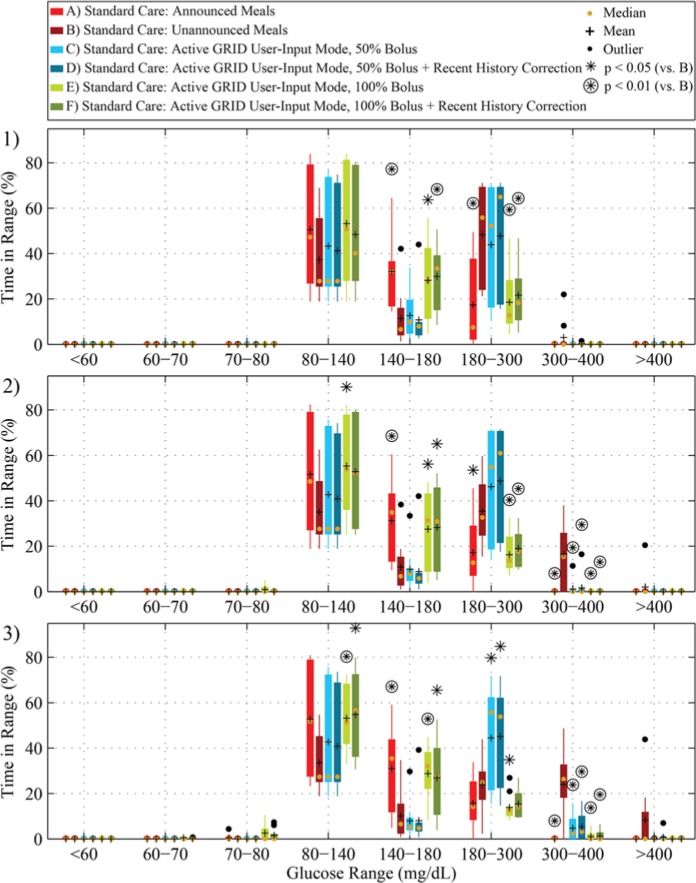
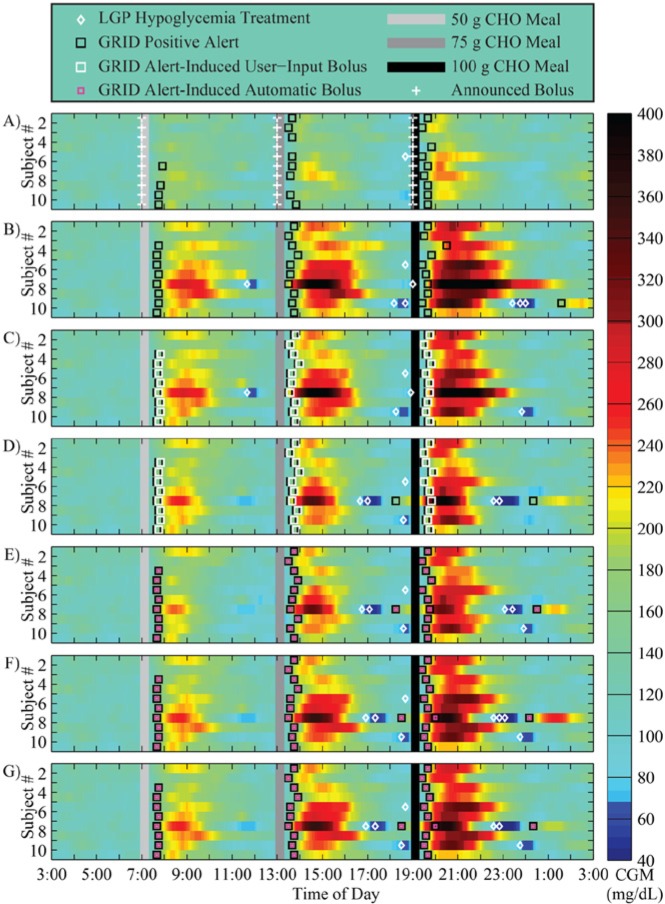
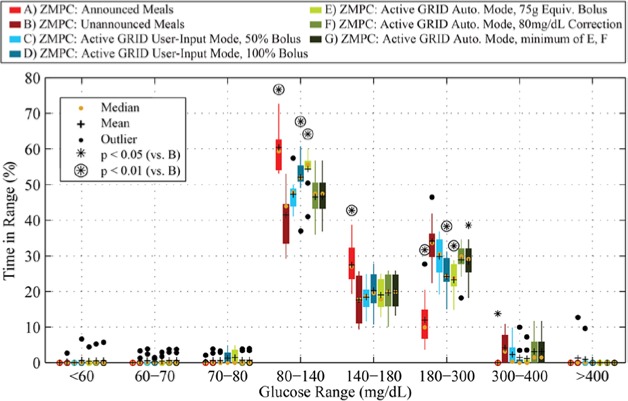
The Glucose Rate Increase Detector (GRID), a module of the Health Monitoring System (HMS), has been designed to operate in parallel to the glucose controller to detect meal events and safely trigger a meal bolus. The GRID algorithm was tuned on clinical data with 40-70 g CHO meals and tested on simulation data with 50-100 g CHO meals. Active closed- and open-loop protocols were executed in silico with various treatments, including automatic boluses based on a 75 g CHO meal and boluses based on simulated user input of meal size. An optional function was used to reduce the recommended bolus using recent insulin and glucose history. For closed-loop control of a 3-meal scenario (50, 75, and 100 g CHO), the GRID improved median time in the 80-180 mg/dL range by 17% and in the >180 range by 14% over unannounced meals, using an automatic bolus for a 75 g CHO meal at detection. Under open-loop control of a 75 g CHO meal, the GRID shifted the median glucose peak down by 73 mg/dL and earlier by 120 min and reduced the time >180 mg/dL by 57% over a missed-meal bolus scenario, using a full meal bolus at detection. The GRID improved closed-loop control in the presence of large meals, without increasing late postprandial hypoglycemia. Users of basal-bolus therapy could also benefit from GRID as a safety alert for missed meal corrections.

Keywords: Health Monitoring System; artificial pancreas; meal detection; safety.


Conflict of interest statement

Declaration of Conflicting Interests: The author(s) declared no potential conflicts of interest with respect to the research, authorship, and/or publication of this article.

Figures

Figure 1.
Figure 1.
Flow chart for GRID treatment protocols, followed after a meal is detected. Automatic Mode protocols are in the green box (on the left) and User-Input Mode protocols are in the blue box (on the right).
Figure 2.
Figure 2.
Block diagram of a fully automated AP with the GRID receiving CGM and insulin delivery information, and, upon detection of a meal, relaying a bolus recommendation to the glucose controller. The HMS is outlined in red, with submodules GRID and LGP outlined in blue, the controller in red, and physical devices and the subject in orange.
Figure 3.
Figure 3.
Results for the GRID (red) and KF (blue), compared with the zone-MPC insulin response (green). (A) Training set from a 12-subject clinical trial using zone-MPC with 2 unannounced meals (50 and 40 g CHO); (B) validation set from a 10-subject clinical trial using zone-MPC, with 3 unannounced meals (70, 40, and 70 g CHO); and (C) simulation set from a 10-subject scenario, with 3 unannounced meals (50, 75, and 100 g CHO). (1) Time of detection; (2) rise in glucose at detection; (3) the percentage of meals that were detected within 2 hours; (4) rate of false positive detections. The metrics with statistically significantly different results from the GRID algorithm (paired t test, P < .05 and P < .01) are shown above the boxes with asterisks and circled asterisks, respectively. Means are shown as crosses and totals in x’s.
Figure 4.
Figure 4.
Results of a cost–benefit analysis of sampling period on meal detection metrics using in silico data. Meals of 25, 50, 75, or 100 g CHO with no bolus are shown in red diamonds, orange squares, green circles, and blue triangles, respectively. Both Zone-MPC, shown in dotted lines with open symbols, or Standard Care (basal/bolus), shown with solid lines and filled symbols, control types were tested. The GRID was executed on the data with sampling periods varying from 1 to 30 minutes. (A) Mean rise in glucose from meal commencement to time of detection; (B) mean time from meal commencement to time of detection; and (C) percentage of meals detected within 2 hours from the start of the meal.
Figure 5.
Figure 5.
Results of an in silico study of 10 adult subjects using the UVA/Padova simulator with a 75 g CHO meal at 4.5 hours. (A) Announced meals using standard basal-bolus therapy; (B) unannounced meals using standard basal-bolus therapy (bolus withheld); (C) unannounced meals using standard therapy and the GRID active in User-Input Mode, delivering a 50% bolus for the meal, 5 minutes after detection; (D) unannounced meals using standard therapy and the GRID active in User-Input Mode, delivering a 50% bolus for the meal plus RHC, 5 minutes after detection; (E) protocol C with a 100% bolus; and (F) protocol D with a 100% bolus. Announced boluses are shown in white crosses, and User-Input Mode delivery in white squares. Meals are shown in gray bars, and GRID positive alerts in black squares.
Figure 6.
Figure 6.
Time in range results of an 18-hour in silico study of 10 adult subjects using the UVA/Padova simulator with, from top to bottom, 50 g (1), 75 g (2), or 100 g (3) CHO meal at 4.5 hours. Scenarios A-F correspond to A-F in Figure 5 and Table 2 in red, dark red, light blue, blue, light green, and green, respectively (from left to right in each grouping). Means are shown in black crosses, and medians in orange dots. Protocols that have statistically significantly different results from the unannounced (B) protocol (paired t test, P < .05 and P < .01) are shown above the boxes with asterisks and circled asterisks, respectively.
Figure 7.
Figure 7.
Results of a 24-hour in silico study of 10 adult subjects using the UVA/Padova simulator with 50, 75, and 100 g CHO meals at 7:00, 13:00, and 19:00, respectively, all using zone-MPC and unannounced meals with active GRID with RHC in C-G. (A) Announced meals using Zone-MPC; (B) unannounced meals; (C) User-Input mode, delivering a 50% bolus for the most recent meal plus, 5 minutes after detection; (D) protocol C with a 100% bolus; (E) Automatic Mode, immediately delivering a bolus for a 75 g CHO; (F) Automatic Mode, immediately delivering a bolus to correct the current level to 80 mg/dL; and (G) minimum of methods used in (E) and (F). Announced boluses are shown in white crosses, Automatic Mode delivery in magenta squares, and User-Input Mode delivery in white squares. Meals are shown in gray and black bars, LGP-alarm rescue carbohydrates in white diamonds, and GRID positive alerts in black squares.
Figure 8.
Figure 8.
Time in range results of a 24-hour in silico study of 10 adult subjects using the UVA/Padova simulator with 50, 75, and 100 g CHO meals at 7:00, 13:00, and 19:00, respectively. Scenarios A-G correspond to A-G in Figure 7 and Table 3 in red, dark red, light blue, blue, light green, green, and dark green, respectively (from left to right in each grouping). Means are shown in black crosses, and medians in orange dots. Protocols that have statistically significantly different results from the unannounced (B) protocol (paired t test, P < .05 and P < .01) are shown above the boxes with asterisks and circled asterisks, respectively.

References

    1. The Diabetes Control and Complications Trial Research Group. The effect of intensive treatment of diabetes on the development and progression of long-term complications in insulin-dependent diabetes mellitus. N Engl J Med. 1993;329:977-986. - PubMed
    1. Bequette BW. Challenges and recent progress in the development of a closed-loop artificial pancreas. Annu Rev Control. 2012;36(2):255-266. - PMC - PubMed
    1. Brazeau AS, Mircescu H, Desjardins K, et al. Carbohydrate counting accuracy and blood glucose variability in adults with type 1 diabetes. Diabetes Res Clin Pract. 2013;99(1):19-23. - PubMed
    1. Shepard JA, Gonder-Frederick L, Vajda K, Kovatchev B. Patient perspectives on personalized glucose advisory systems for type 1 diabetes management. Diabetes Technol Ther. 2012;14(10):858-861. - PMC - PubMed
    1. van Bon AC, Kohinor MJ, Hoekstra JB, von Basum G, deVries JH. Patients’ perception and future acceptance of an artificial pancreas. J Diabetes Sci Technol. 2010;4(3):596-602. - PMC - PubMed