

A model of glucose-insulin-pramlintide pharmacokinetics and pharmacodynamics in type I diabetes
- PMID: 24876617
- PMCID: PMC4455443
- DOI: 10.1177/1932296813517323
A model of glucose-insulin-pramlintide pharmacokinetics and pharmacodynamics in type I diabetes
Abstract
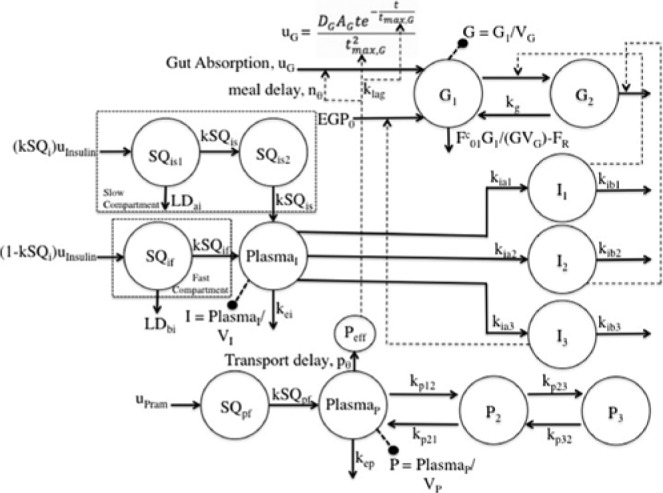
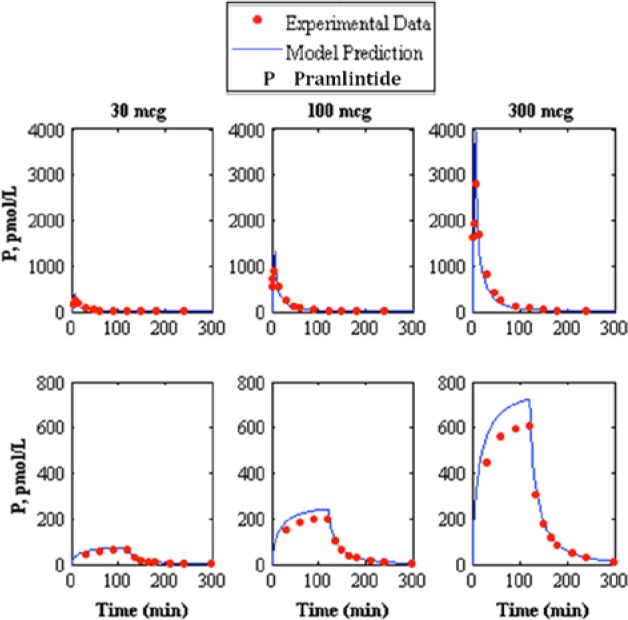
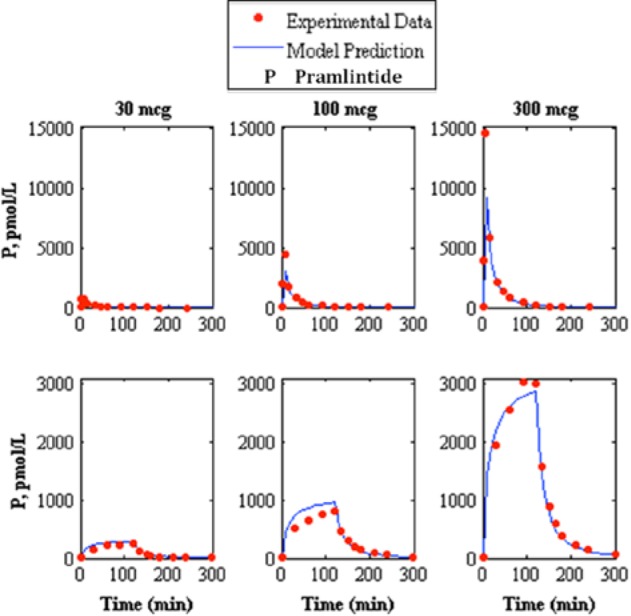
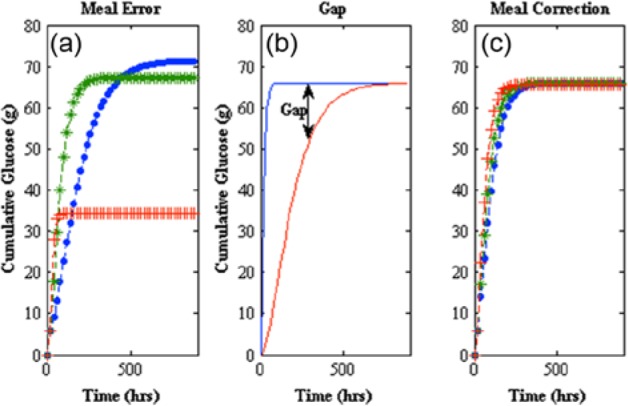
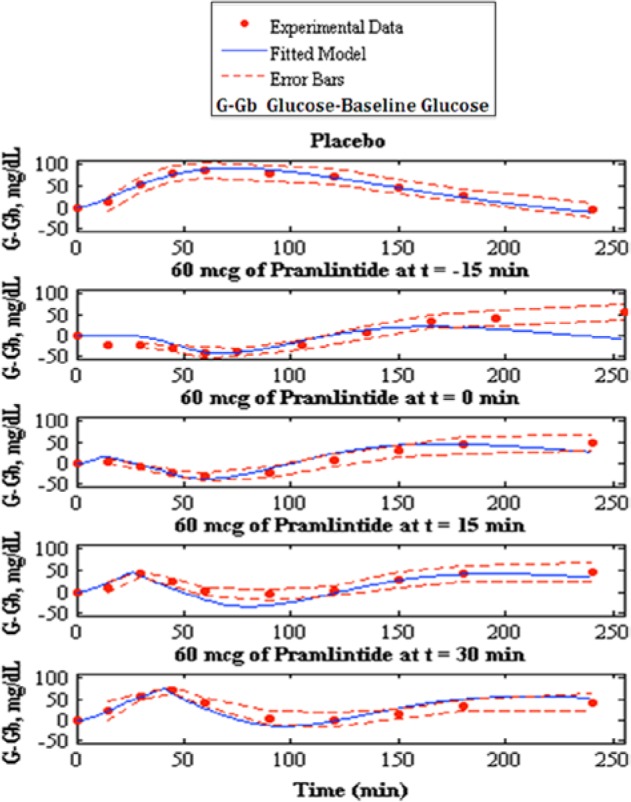
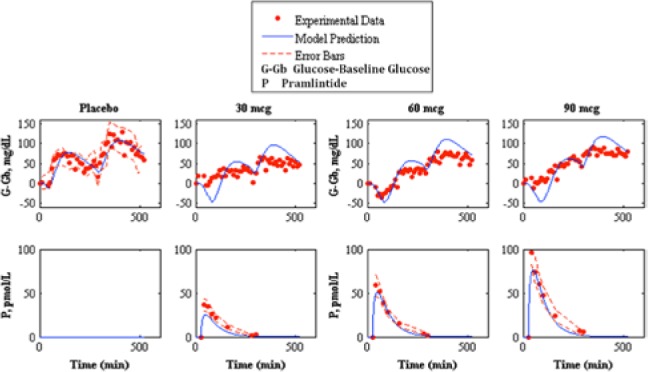
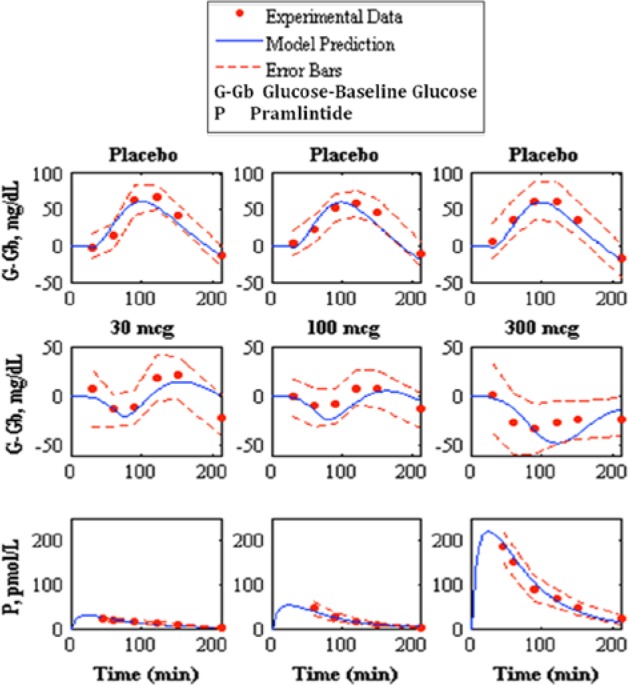
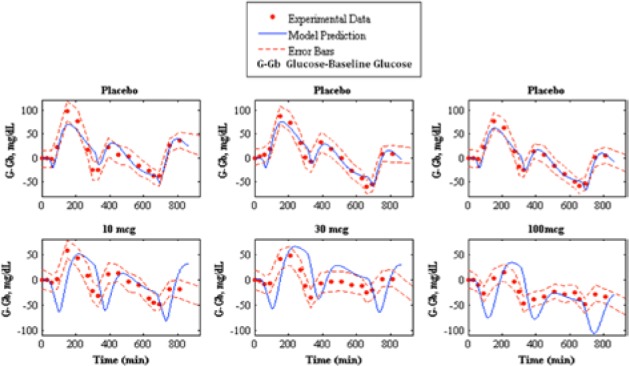
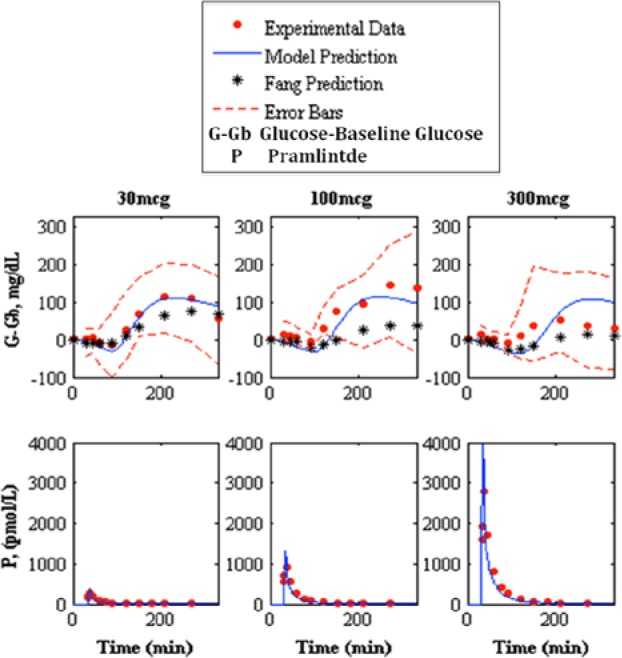
Type 1 diabetes mellitus (T1DM) complications are significantly reduced when normoglycemic levels are maintained via intensive therapy. The artificial pancreas is designed for intensive glycemic control; however, large postprandial excursions after a meal result in poor glucose regulation. Pramlintide, a synthetic analog of the hormone amylin, reduces the severity of postprandial excursions by reducing appetite, suppressing glucagon release, and slowing the rate of gastric emptying. The goal of this study is to create a glucose-insulin-pramlintide physiological model that can be employed into a controller to improve current control approaches used in the artificial pancreas. A model of subcutaneous (SC) pramlintide pharmacokinetics (PK) was developed by revising an intravenous (IV) pramlintide PK model and adapting SC insulin PK from a glucose-insulin model. Gray-box modeling and least squares optimization were used to obtain parameter estimates. Pharmacodynamics (PD) were obtained by choosing parameters most applicable to pramlintide mechanisms and then testing using a proportional PD effect using least squares optimization. The model was fit and validated using 27 data sets, which included placebo, PK, and PD data. SC pramlintide PK root mean square error values range from 1.98 to 10.66 pmol/L. Pramlintide PD RMSE values range from 10.48 to 42.76 mg/dL. A new in silico model of the glucose-insulin-pramlintide regulatory system is presented. This model can be used as a platform to optimize dosing of both pramlintide and insulin as a combined therapy for glycemic regulation, and in the development of an artificial pancreas as the kernel for a model-based controller.
Keywords: artificial pancreas; physiology model; postprandial hyperglycemia; pramlintide; type 1 diabetes mellitus.
© 2014 Diabetes Technology Society.
Conflict of interest statement
Figures
Similar articles
-
Pramlintide reduces postprandial glucose excursions when added to regular insulin or insulin lispro in subjects with type 1 diabetes: a dose-timing study.Diabetes Care. 2003 Nov;26(11):3074-9. doi: 10.2337/diacare.26.11.3074. Diabetes Care. 2003. PMID: 14578242 Clinical Trial.
-
Control of Postprandial Hyperglycemia in Type 1 Diabetes by 24-Hour Fixed-Dose Coadministration of Pramlintide and Regular Human Insulin: A Randomized, Two-Way Crossover Study.Diabetes Care. 2018 Nov;41(11):2346-2352. doi: 10.2337/dc18-1091. Epub 2018 Sep 13. Diabetes Care. 2018. PMID: 30213882 Clinical Trial.
-
Impact of pramlintide on glucose fluctuations and postprandial glucose, glucagon, and triglyceride excursions among patients with type 1 diabetes intensively treated with insulin pumps.Diabetes Care. 2003 Jan;26(1):1-8. doi: 10.2337/diacare.26.1.1. Diabetes Care. 2003. PMID: 12502651 Clinical Trial.
-
Pramlintide acetate injection for the treatment of type 1 and type 2 diabetes mellitus.Clin Ther. 2007 Apr;29(4):535-62. doi: 10.1016/j.clinthera.2007.04.005. Clin Ther. 2007. PMID: 17617279 Review.
-
Pramlintide in the treatment of type 1 and type 2 diabetes mellitus.Clin Ther. 2005 Oct;27(10):1500-12. doi: 10.1016/j.clinthera.2005.10.009. Clin Ther. 2005. PMID: 16330288 Review.
Cited by
-
Adjuvant Liraglutide and Insulin Versus Insulin Monotherapy in the Closed-Loop System in Type 1 Diabetes: A Randomized Open-Labeled Crossover Design Trial.J Diabetes Sci Technol. 2016 Aug 22;10(5):1108-14. doi: 10.1177/1932296816647976. Print 2016 Sep. J Diabetes Sci Technol. 2016. PMID: 27184690 Free PMC article. Clinical Trial.
-
Pharmacological Treatment in Diabetes Mellitus Type 1 - Insulin and What Else?Int J Endocrinol Metab. 2017 Nov 20;16(1):e13008. doi: 10.5812/ijem.13008. eCollection 2018 Jan. Int J Endocrinol Metab. 2017. PMID: 29696037 Free PMC article. Review.
References
-
- Steil GM, Rebrin K. Closed-loop insulin delivery—what lies between where we are and where we are going? Expert Opin Drug Del. 2005;2:353-362. - PubMed
-
- Hovorka R. Continuous glucose monitoring and closed-loop systems. Diabetic Med. 2006;23:1-12. - PubMed
-
- Renard E, Costalat G, Chevassus H, Bringer J. Artificial beta-cell: clinical experience toward an implantable closed-loop insulin delivery system. Diabetes Metab. 2006;32:497-502. - PubMed
Publication types
MeSH terms
Substances
LinkOut - more resources
Full Text Sources
Other Literature Sources
Medical
