

Statistical transformation and the interpretation of inpatient glucose control data from the intensive care unit
- PMID: 24876620
- PMCID: PMC4455452
- DOI: 10.1177/1932296814524873
Statistical transformation and the interpretation of inpatient glucose control data from the intensive care unit
Abstract
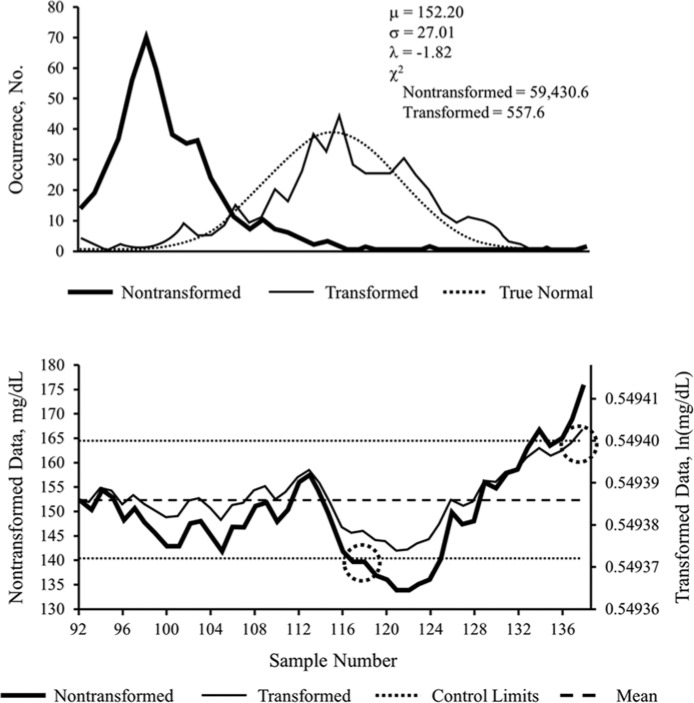
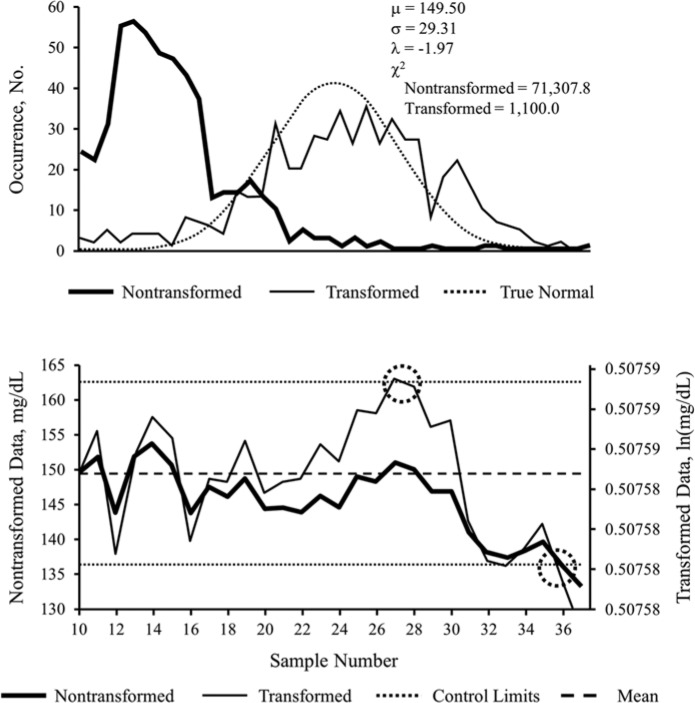
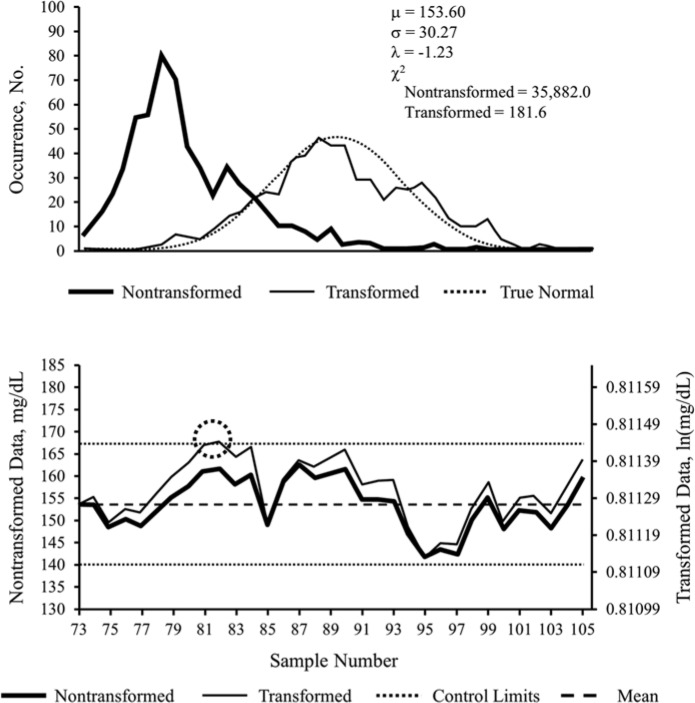
Glucose control can be problematic in critically ill patients. We evaluated the impact of statistical transformation on interpretation of intensive care unit inpatient glucose control data. Point-of-care blood glucose (POC-BG) data derived from patients in the intensive care unit for 2011 was obtained. Box-Cox transformation of POC-BG measurements was performed, and distribution of data was determined before and after transformation. Different data subsets were used to establish statistical upper and lower control limits. Exponentially weighted moving average (EWMA) control charts constructed from April, October, and November data determined whether out-of-control events could be identified differently in transformed versus nontransformed data. A total of 8679 POC-BG values were analyzed. POC-BG distributions in nontransformed data were skewed but approached normality after transformation. EWMA control charts revealed differences in projected detection of out-of-control events. In April, an out-of-control process resulting in the lower control limit being exceeded was identified at sample 116 in nontransformed data but not in transformed data. October transformed data detected an out-of-control process exceeding the upper control limit at sample 27 that was not detected in nontransformed data. Nontransformed November results remained in control, but transformation identified an out-of-control event less than 10 samples into the observation period. Using statistical methods to assess population-based glucose control in the intensive care unit could alter conclusions about the effectiveness of care processes for managing hyperglycemia. Further study is required to determine whether transformed versus nontransformed data change clinical decisions about the interpretation of care or intervention results.
Keywords: diabetes; hospital; hyperglycemia; inpatient; statistical process control.
© 2014 Diabetes Technology Society.
Conflict of interest statement
Figures
Similar articles
-
Statistical transformation and the interpretation of inpatient glucose control data.Endocr Pract. 2014 Mar;20(3):207-12. doi: 10.4158/EP13186.OR. Endocr Pract. 2014. PMID: 24013995
-
Inpatient glucose control: a glycemic survey of 126 U.S. hospitals.J Hosp Med. 2009 Nov;4(9):E7-E14. doi: 10.1002/jhm.533. J Hosp Med. 2009. PMID: 20013863
-
Clinical Reliability of Point-of-Care Glucose Testing in Critically Ill Patients.J Diabetes Sci Technol. 2020 Jan;14(1):65-69. doi: 10.1177/1932296819858633. Epub 2019 Jul 7. J Diabetes Sci Technol. 2020. PMID: 31282177 Free PMC article.
-
[Glucose variability in intensive care unit].Ann Fr Anesth Reanim. 2012 Dec;31(12):950-60. doi: 10.1016/j.annfar.2012.09.002. Epub 2012 Oct 26. Ann Fr Anesth Reanim. 2012. PMID: 23107472 Review. French.
-
Reducing glycemic variability in intensive care unit patients: a new therapeutic target?J Diabetes Sci Technol. 2009 Nov 1;3(6):1302-8. doi: 10.1177/193229680900300610. J Diabetes Sci Technol. 2009. PMID: 20144384 Free PMC article. Review.
Cited by
-
How is the weather? Forecasting inpatient glycemic control.Future Sci OA. 2017 Sep 11;3(4):FSO241. doi: 10.4155/fsoa-2017-0066. eCollection 2017 Nov. Future Sci OA. 2017. PMID: 29134125 Free PMC article.
References
-
- Swanson CM, Potter DJ, Kongable GL, Cook CB. An update on inpatient glycemic control in US hospitals. Endocr Pract. 2011;17:853-861. - PubMed
-
- Moghissi ES, Korytkowski MT, DiNardo M, et al. American Association of Clinical Endocrinologists and American Diabetes Association consensus statement on inpatient glycemic control. Endocr Pract. 2009;15(4):1-17. - PubMed
-
- American Association of Clinical Endocrinologists. AACE Diabetes Resource Center. Available at: http://inpatient.aace.com/. Accessed November 7, 2013.
-
- Society of Hospital Medicine. Glycemic Control Resource Room. Available at: http://www.hospitalmedicine.org/ResourceRoomRedesign/GlycemicControl.cfm. Accessed November 13, 2013.
MeSH terms
Substances
LinkOut - more resources
Full Text Sources
Other Literature Sources
Medical
Miscellaneous
