

Prospective analysis of 18F-FDG PET/CT predictive value in patients with low rectal cancer treated with neoadjuvant chemoradiotherapy and conservative surgery
- PMID: 24877151
- PMCID: PMC4024401
- DOI: 10.1155/2014/952843
Prospective analysis of 18F-FDG PET/CT predictive value in patients with low rectal cancer treated with neoadjuvant chemoradiotherapy and conservative surgery
Abstract
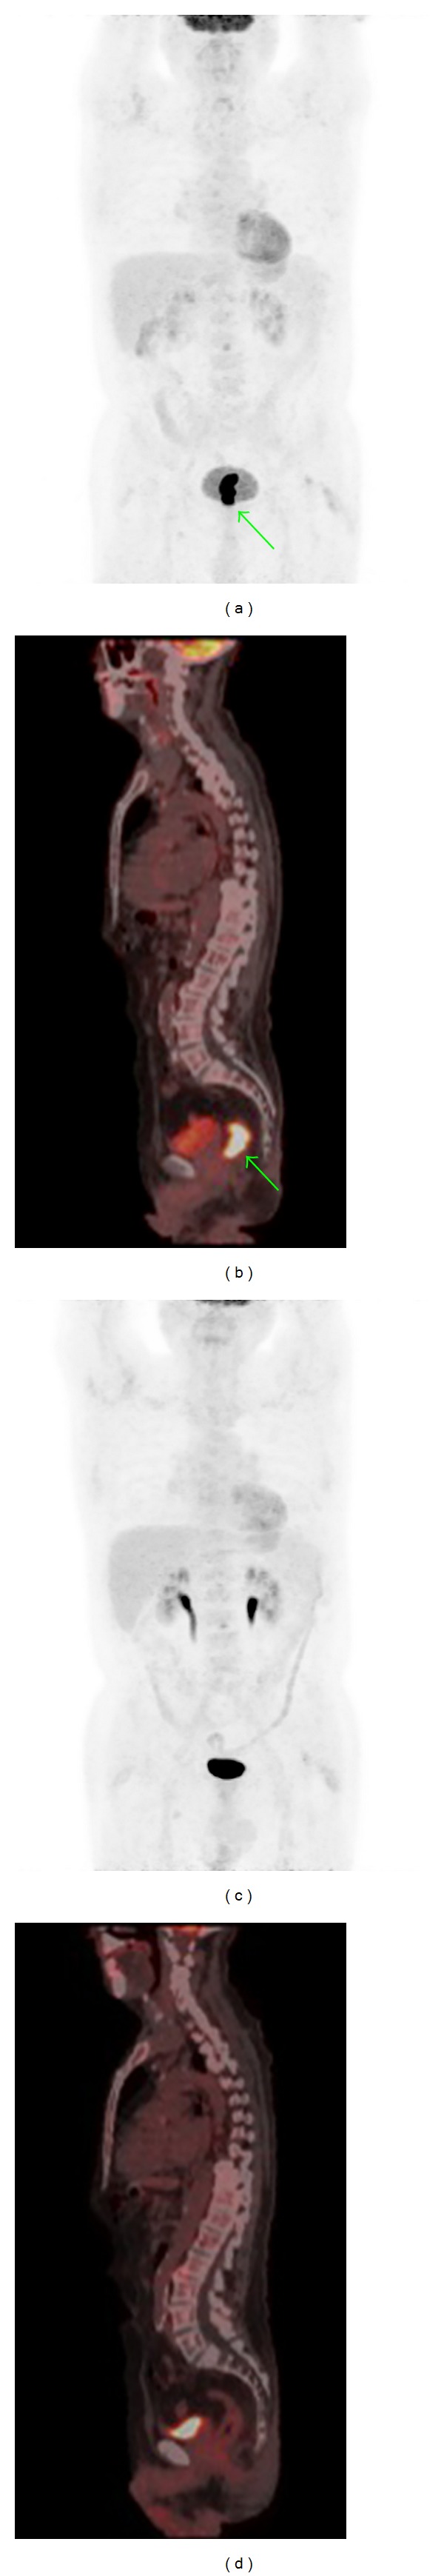
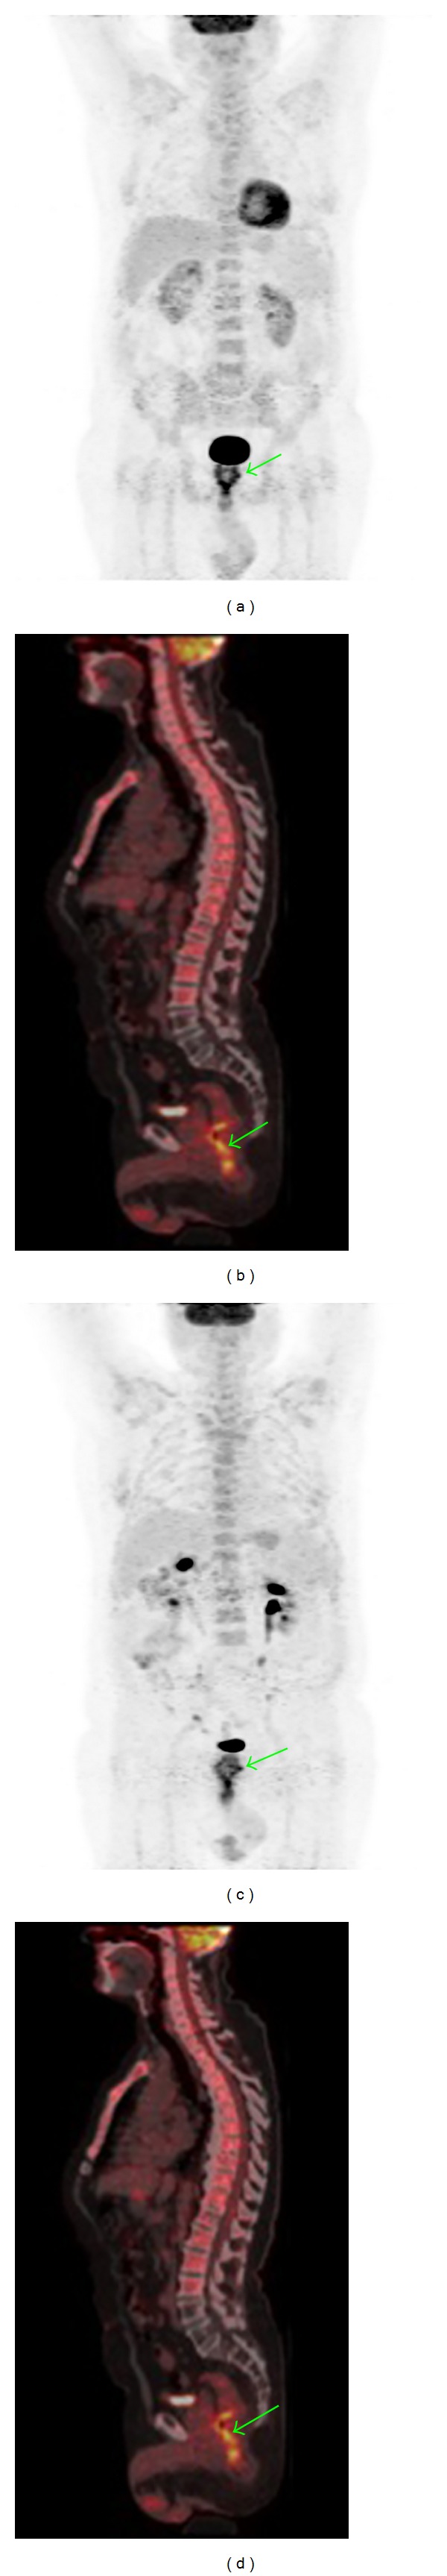
This study prospectively assessed (18)F-FDG PET/CT in predicting the response of locally advanced low rectal cancer (LRC) to neoadjuvant chemoradiation (nCRT).
Methods: 56 patients treated with chemoradiation underwent two (18)F-FDG PET/CT scans (baseline and 5-6 weeks post-nCRT). (18)F-FDG uptake (SUVmax and SUVmean) and differences between baseline (SUV1) and post-nCRT (SUV2) scans (ΔSUV and RI%) were evaluated. Results were related to the Mandard's TRG and (y)pTNM.
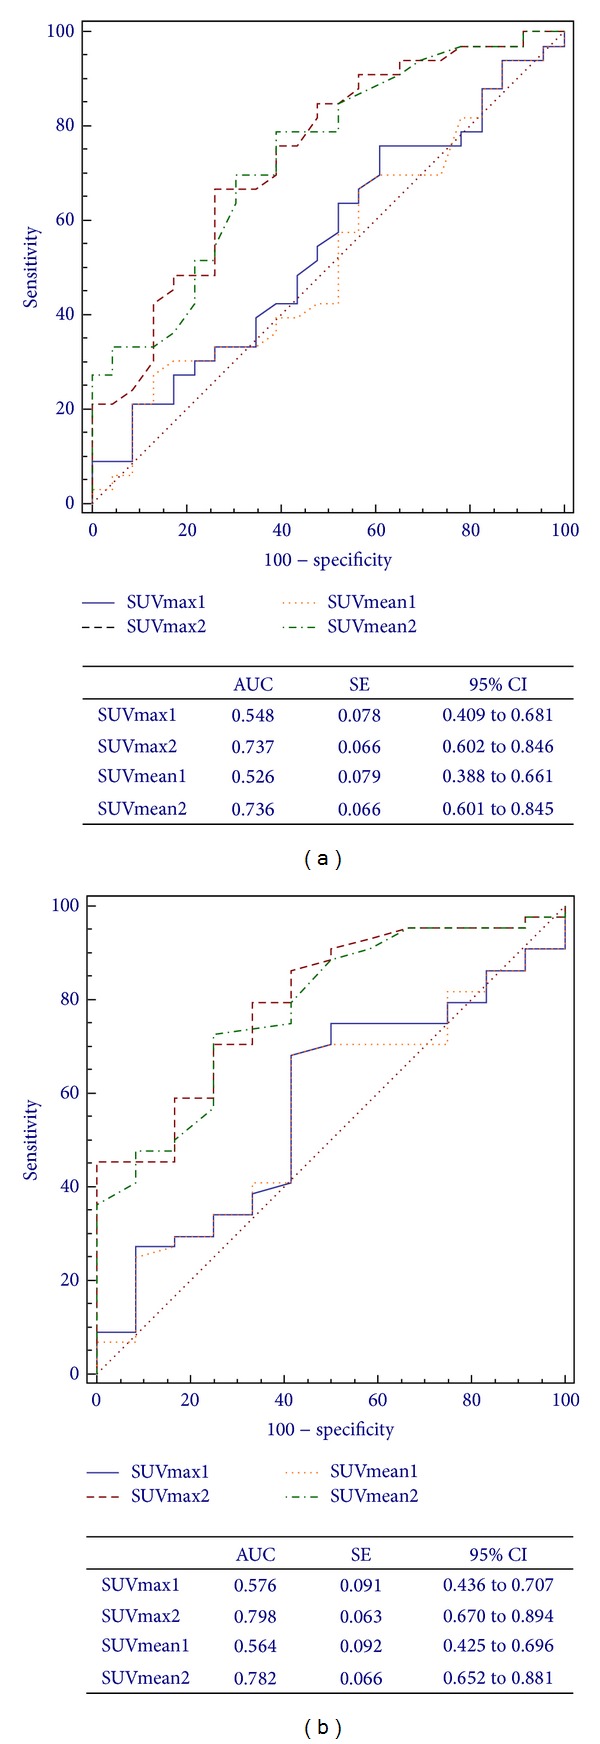
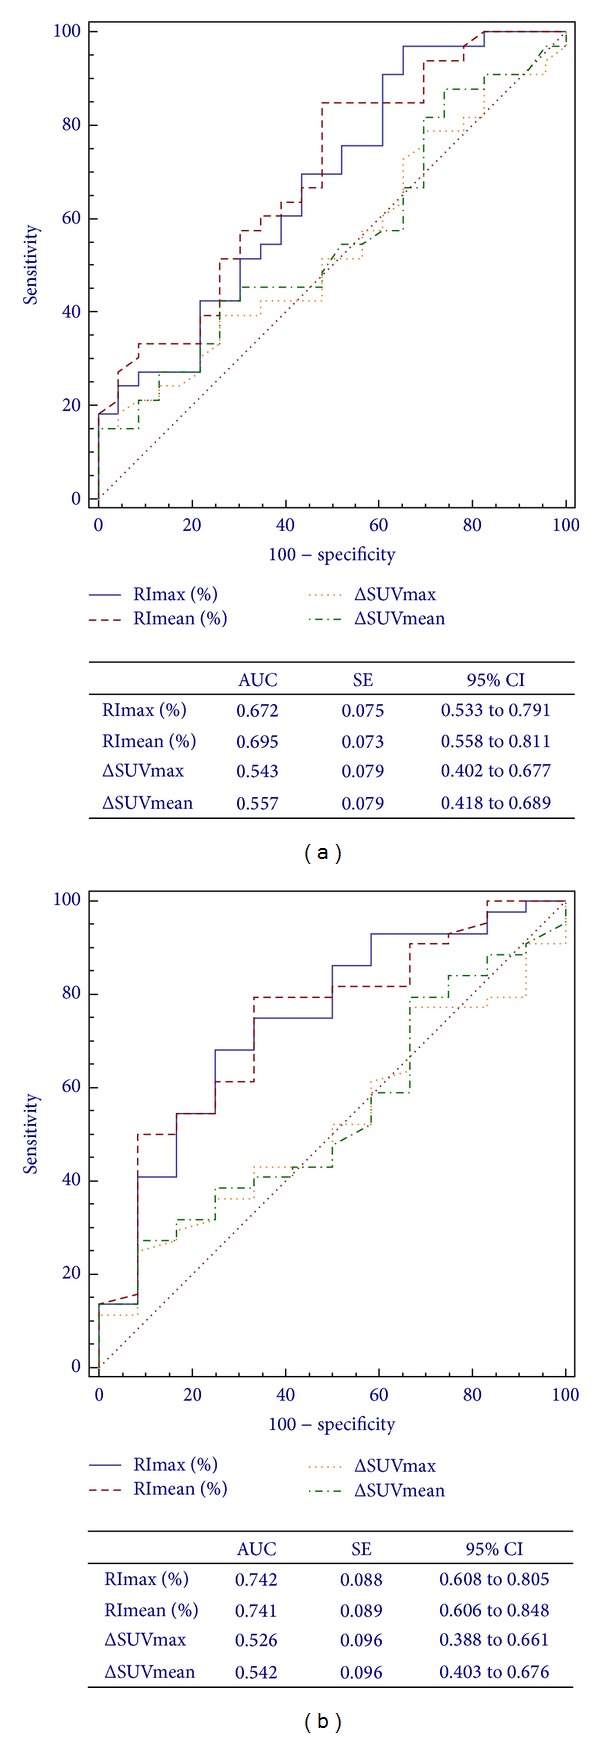
Results: (18)F-FDG PET/CT sensitivity, specificity, accuracy, PPV and NPV resulted in 88.6%, 66.7%, 83.92%, 90.7%, and 61.5%. SUV2 resulted in better than SUV1 to predict nCRT response by TRG, with no significant statistical difference between the SUVmax2 and SUVmean2 AUC (0.737 versus 0.736; P = 0.928). The same applies to the (y)pTNM (0.798 versus 0.782; P = 0.192). In relation to the TRG, RI values had a higher AUC than ΔSUV, with no significant difference between RImax and RImean (0.672 versus 0.695; P = 0.292). The same applied to the (y)pTNM (0.742 versus 0.741; P = 0.940). In both cases ΔSUV does not appear to be a good predictive tool. Logistic regression confirmed the better predictive role of SUVmax2 for the (y)pTNM (odds ratio = 1.58) and SUVmean2 for the TRG (odds ratio = 1.87).
Conclusions: (18)F-FDG PET/CT can evaluate response to nCRT in LRC, even if more studies are required to define the most significant parameter for predicting pathologic tumor changes.
Figures
References
-
- Grassetto G, Marzola MC, Minicozzi A, Al-Nahhas A, Rubello D. F-18 FDG PET/CT in rectal carcinoma: where are we now? Clinical Nuclear Medicine. 2011;36(10):884–888. - PubMed
-
- National Comprehensive Cancer Network Clinical Practice Guidelines in Oncology: Rectal Cancer, Version 2. 2010, http://www.nccn.org/ - PubMed
-
- Capirci C, Rampin L, Erba PA, et al. Sequential FDG-PET/CT reliably predicts response of locally advanced rectal cancer to neo-adjuvant chemo-radiation therapy. European Journal of Nuclear Medicine and Molecular Imaging. 2007;34(10):1583–1593. - PubMed
-
- Gearhart SL, Frassica D, Rosen R, Choti M, Schulick R, Wahl R. Improved staging with pretreatment positron emission tomography/computed tomography in low rectal cancer. Annals of Surgical Oncology. 2006;13(3):397–404. - PubMed
-
- Kapiteijn E, Marijnen CA, Nagtegaal ID, et al. Preoperative radiotherapy combined with total mesorectal excision for resectable rectal cancer. New England Journal of Medicine. 2001;345(9):638–646. - PubMed
Publication types
MeSH terms
Substances
LinkOut - more resources
Full Text Sources
Other Literature Sources
Medical
