

Role of notch signaling in the maintenance of human mesenchymal stem cells under hypoxic conditions
- PMID: 24878247
- PMCID: PMC4155482
- DOI: 10.1089/scd.2013.0642
Role of notch signaling in the maintenance of human mesenchymal stem cells under hypoxic conditions
Abstract
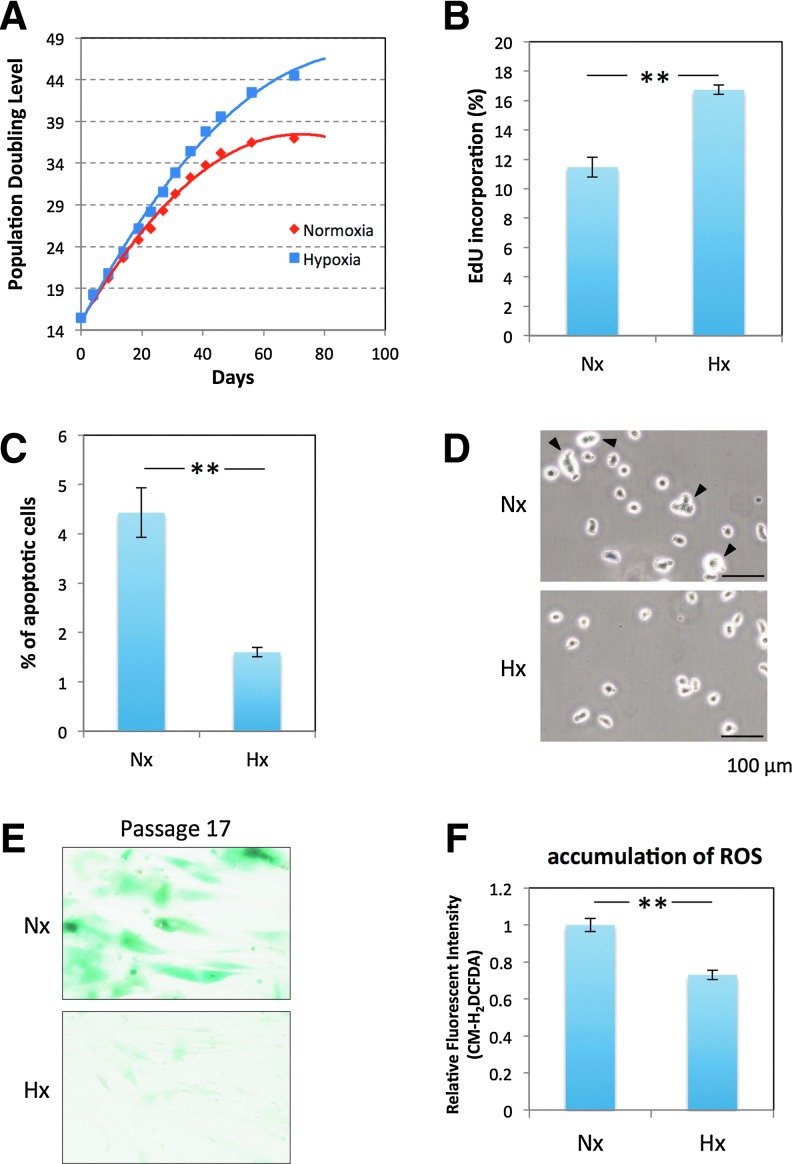
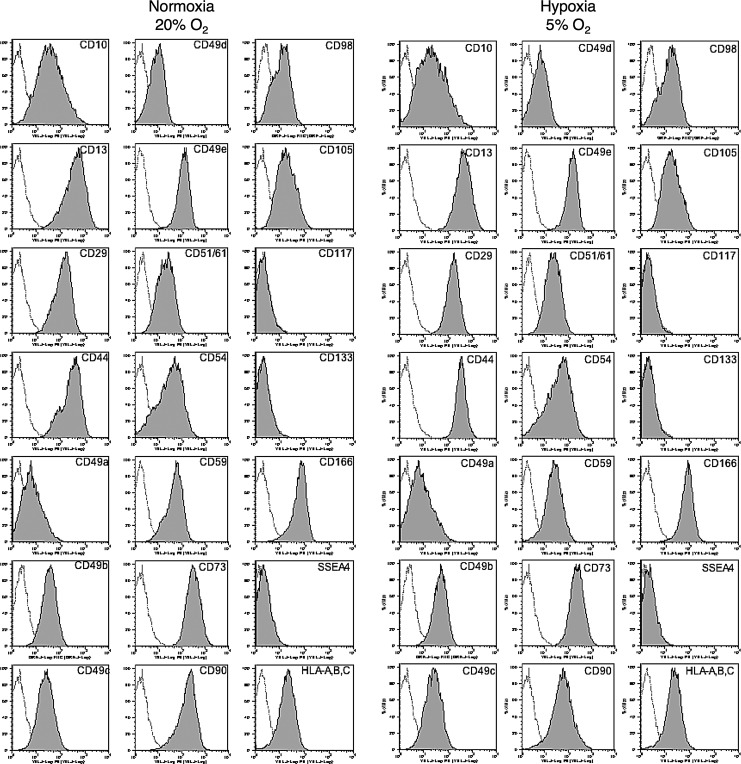
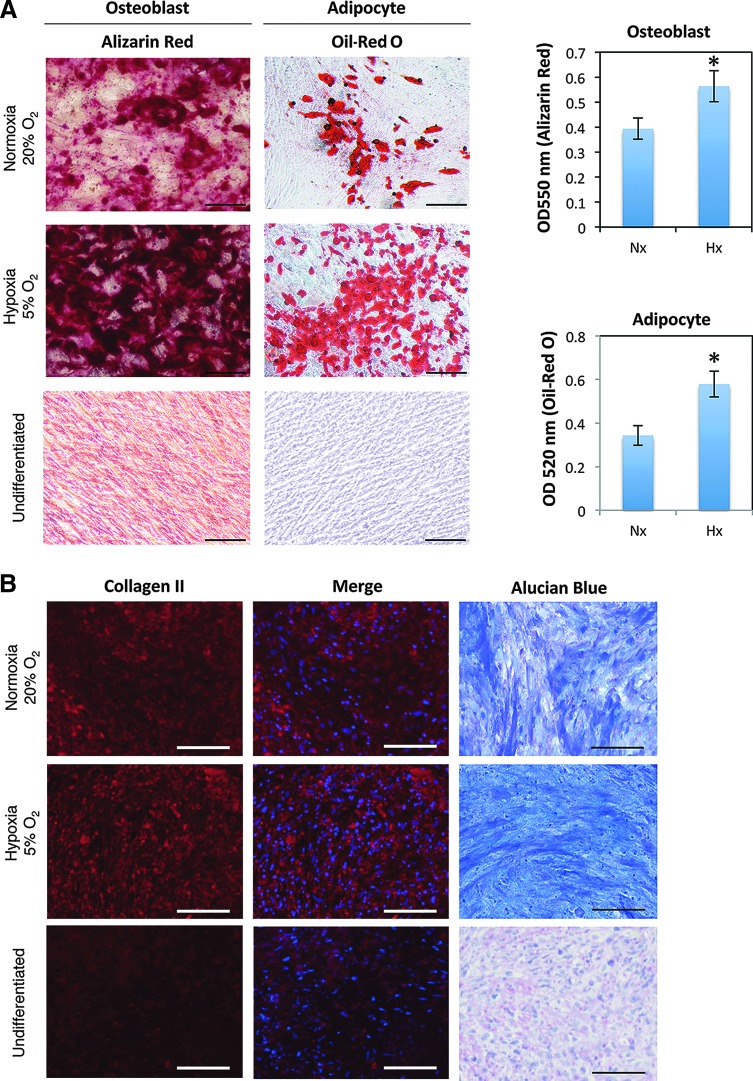
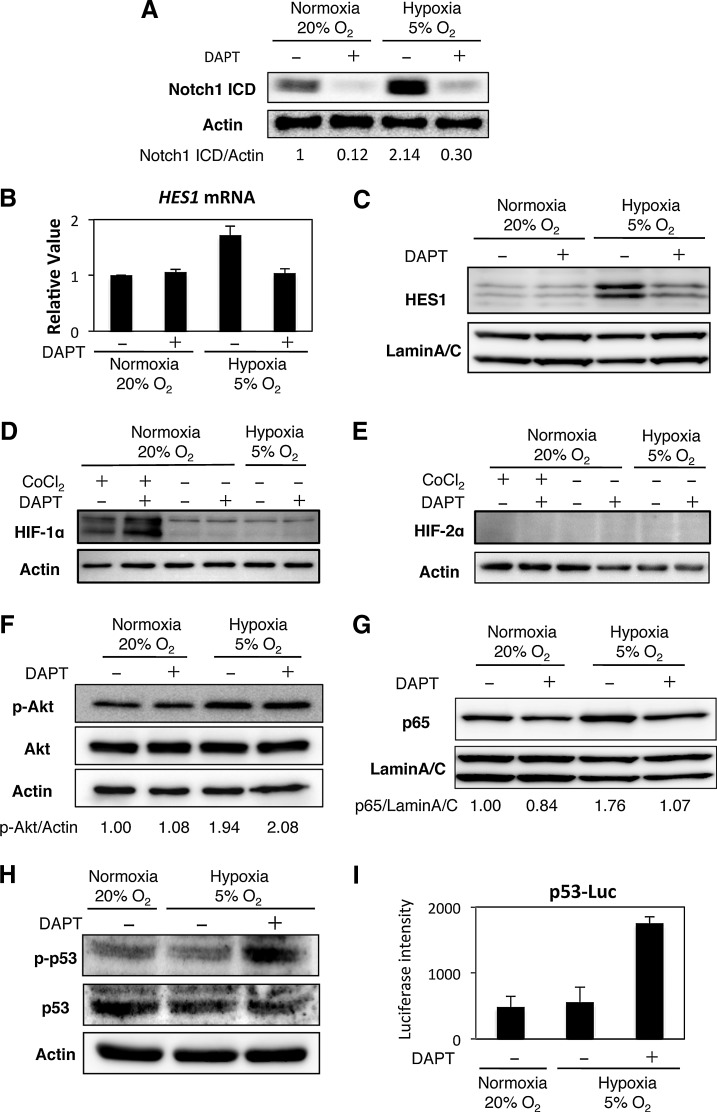
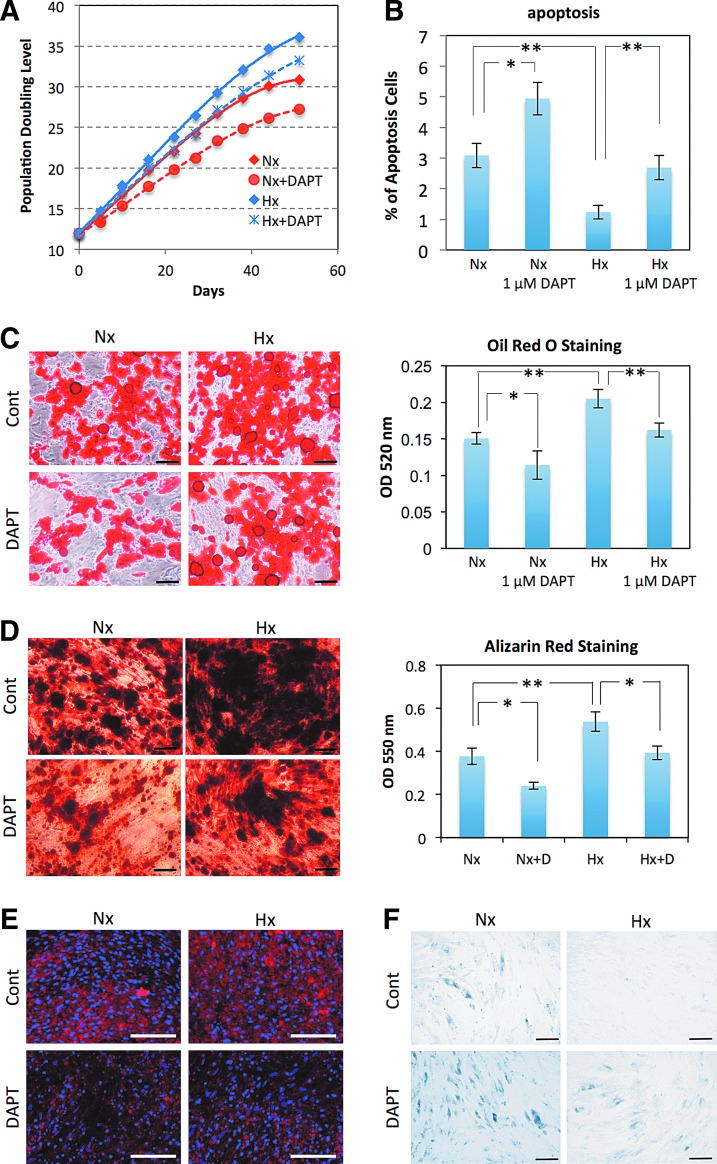
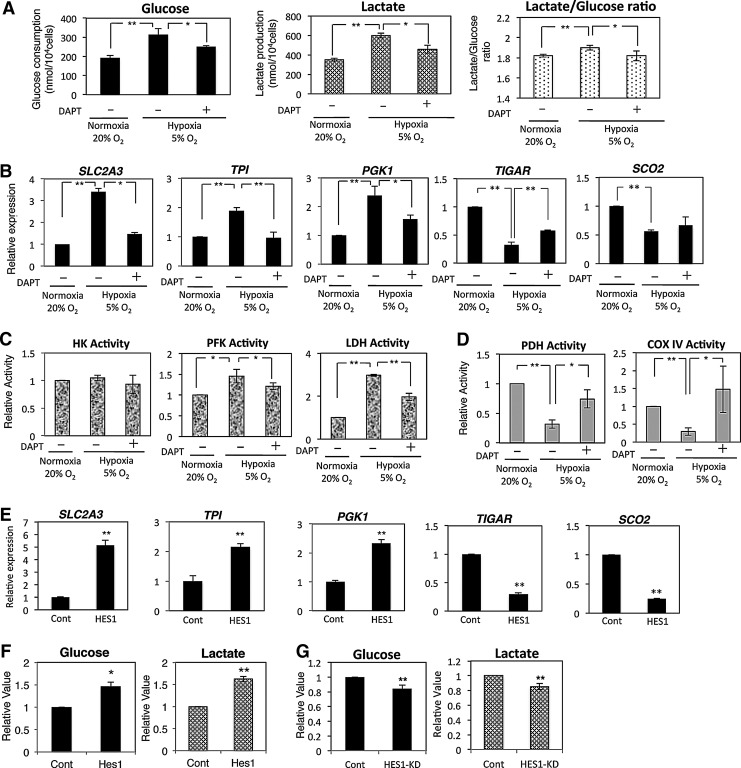
Human adipose tissue-derived multilineage progenitor cells (hADMPCs) are attractive for cell therapy and tissue engineering because of their multipotency and ease of isolation without serial ethical issues. However, their limited in vitro lifespan in culture systems hinders their therapeutic application. Some somatic stem cells, including hADMPCs, are known to be localized in hypoxic regions; thus, hypoxia may be beneficial for ex vivo culture of these stem cells. These cells exhibit a high level of glycolytic metabolism in the presence of high oxygen levels and further increase their glycolysis rate under hypoxia. However, the physiological role of glycolytic activation and its regulatory mechanisms are still incompletely understood. Here, we show that Notch signaling is required for glycolysis regulation under hypoxic conditions. Our results demonstrate that 5% O2 dramatically increased the glycolysis rate, improved the proliferation efficiency, prevented senescence, and maintained the multipotency of hADMPCs. Intriguingly, these effects were not mediated by hypoxia-inducible factor (HIF), but rather by the Notch signaling pathway. Five percent O2 significantly increased the level of activated Notch1 and expression of its downstream gene, HES1. Furthermore, 5% O2 markedly increased glucose consumption and lactate production of hADMPCs, which decreased back to normoxic levels on treatment with a γ-secretase inhibitor. We also found that HES1 was involved in induction of GLUT3, TPI, and PGK1 in addition to reduction of TIGAR and SCO2 expression. These results clearly suggest that Notch signaling regulates glycolysis under hypoxic conditions and, thus, likely affects the cell lifespan via glycolysis.
Figures
Similar articles
-
Notch Signaling Enhances Stemness by Regulating Metabolic Pathways Through Modifying p53, NF-κB, and HIF-1α.Stem Cells Dev. 2018 Jul 1;27(13):935-947. doi: 10.1089/scd.2017.0260. Epub 2018 May 30. Stem Cells Dev. 2018. PMID: 29717634
-
Methylprednisolone inhibits the proliferation and affects the differentiation of rat spinal cord-derived neural progenitor cells cultured in low oxygen conditions by inhibiting HIF-1α and Hes1 in vitro.Int J Mol Med. 2014 Sep;34(3):788-95. doi: 10.3892/ijmm.2014.1835. Epub 2014 Jul 3. Int J Mol Med. 2014. PMID: 24992925
-
Hypoxic culture enhances the expansion of rat bone marrow-derived mesenchymal stem cells via the regulatory pathways of cell division and apoptosis.In Vitro Cell Dev Biol Anim. 2018 Oct;54(9):666-676. doi: 10.1007/s11626-018-0281-3. Epub 2018 Aug 22. In Vitro Cell Dev Biol Anim. 2018. PMID: 30136033
-
The interplay between the cellular hypoxic response and Notch signaling.Exp Cell Res. 2017 Jul 15;356(2):146-151. doi: 10.1016/j.yexcr.2017.04.030. Epub 2017 Apr 26. Exp Cell Res. 2017. PMID: 28456549 Review.
-
Hypoxic culture conditions as a solution for mesenchymal stem cell based regenerative therapy.ScientificWorldJournal. 2013 Aug 27;2013:632972. doi: 10.1155/2013/632972. eCollection 2013. ScientificWorldJournal. 2013. PMID: 24068884 Free PMC article. Review.
Cited by
-
[Role of Notch 1 signaling and glycolysis in the pathogenic mechanism of adenomyosis].Nan Fang Yi Ke Da Xue Xue Bao. 2024 Aug 20;44(8):1599-1604. doi: 10.12122/j.issn.1673-4254.2024.08.19. Nan Fang Yi Ke Da Xue Xue Bao. 2024. PMID: 39276056 Free PMC article. Chinese.
-
Adipose-derived stromal/stem cells improve epidermal homeostasis.Sci Rep. 2019 Dec 4;9(1):18371. doi: 10.1038/s41598-019-54797-5. Sci Rep. 2019. PMID: 31797970 Free PMC article.
-
[Hypoxia promotes differentiation of human induced pluripotent stem cells into embryoid bodies in vitro].Nan Fang Yi Ke Da Xue Xue Bao. 2022 Jun 20;42(6):929-936. doi: 10.12122/j.issn.1673-4254.2022.06.18. Nan Fang Yi Ke Da Xue Xue Bao. 2022. PMID: 35790445 Free PMC article. Chinese.
-
Hypoxia Inhibits De Novo Vascular Assembly of Adipose-Derived Stromal/Stem Cell Populations, but Promotes Growth of Preformed Vessels.Tissue Eng Part A. 2016 Jan;22(1-2):161-9. doi: 10.1089/ten.TEA.2015.0421. Epub 2015 Dec 9. Tissue Eng Part A. 2016. PMID: 26481655 Free PMC article.
-
Targeting Notch to overcome radiation resistance.Oncotarget. 2016 Feb 16;7(7):7610-28. doi: 10.18632/oncotarget.6714. Oncotarget. 2016. PMID: 26713603 Free PMC article. Review.
References
-
- Okura H, Komoda H, Saga A, Kakuta-Yamamoto A, Hamada Y, Fumimoto Y, Lee CM, Ichinose A, Sawa Y. and Matsuyama A. (2010). Properties of hepatocyte-like cell clusters from human adipose tissue-derived mesenchymal stem cells. Tissue Eng Part C Methods 16:761–770 - PubMed
-
- Okura H, Matsuyama A, Lee CM, Saga A, Kakuta-Yamamoto A, Nagao A, Sougawa N, Sekiya N, Takekita K, et al. (2010). Cardiomyoblast-like cells differentiated from human adipose tissue-derived mesenchymal stem cells improve left ventricular dysfunction and survival in a rat myocardial infarction model. Tissue Eng Part C Methods 16:417–425 - PubMed
-
- Okura H, Komoda H, Fumimoto Y, Lee CM, Nishida T, Sawa Y. and Matsuyama A. (2009). Transdifferentiation of human adipose tissue-derived stromal cells into insulin-producing clusters. J Artif Organs 12:123–130 - PubMed
-
- Safford KM, Safford SD, Gimble JM, Shetty AK. and Rice HE. (2004). Characterization of neuronal/glial differentiation of murine adipose-derived adult stromal cells. Exp Neurol 187:319–328 - PubMed
Publication types
MeSH terms
Substances
LinkOut - more resources
Full Text Sources
Other Literature Sources
Miscellaneous
