. 2014 Nov;1839(11):1273-82.
doi: 10.1016/j.bbagrm.2014.05.018. Epub 2014 May 27.

GATA4 represses an ileal program of gene expression in the proximal small intestine by inhibiting the acetylation of histone H3, lysine 27

Affiliations

GATA4 represses an ileal program of gene expression in the proximal small intestine by inhibiting the acetylation of histone H3, lysine 27

B E Aronson et al. Biochim Biophys Acta. 2014 Nov.

Abstract

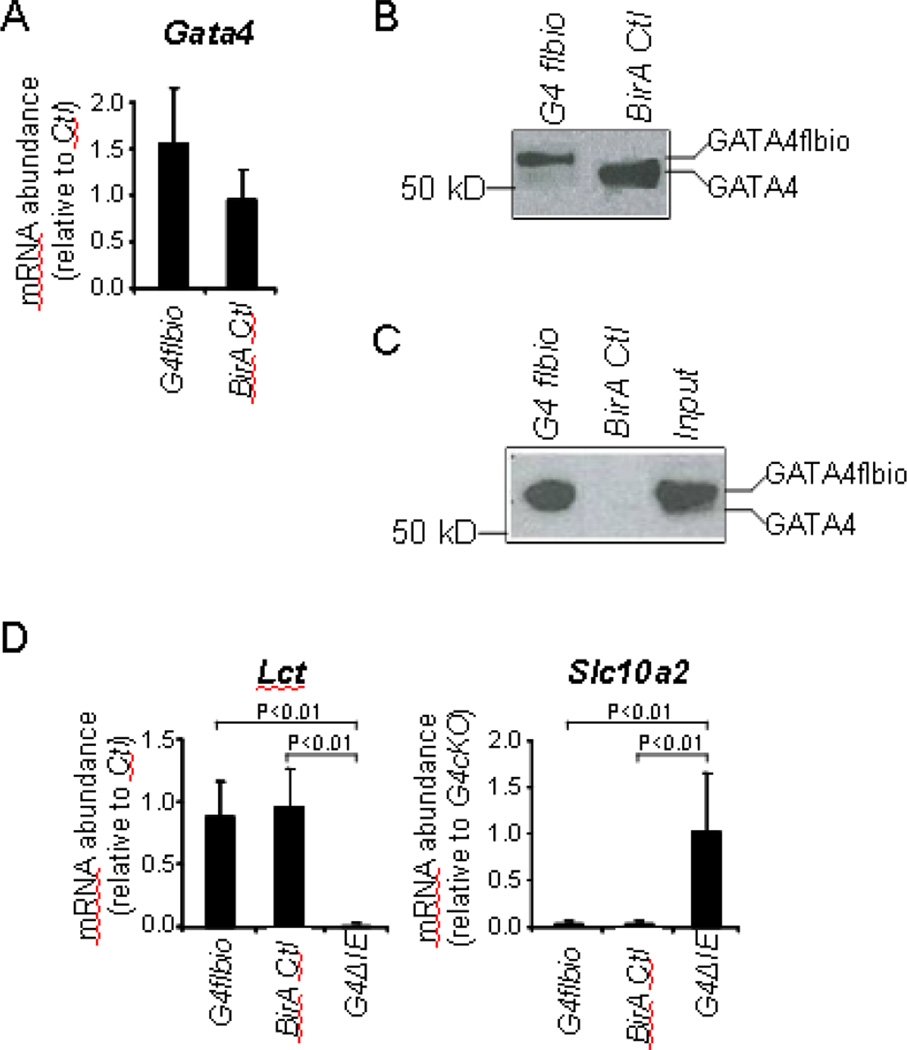
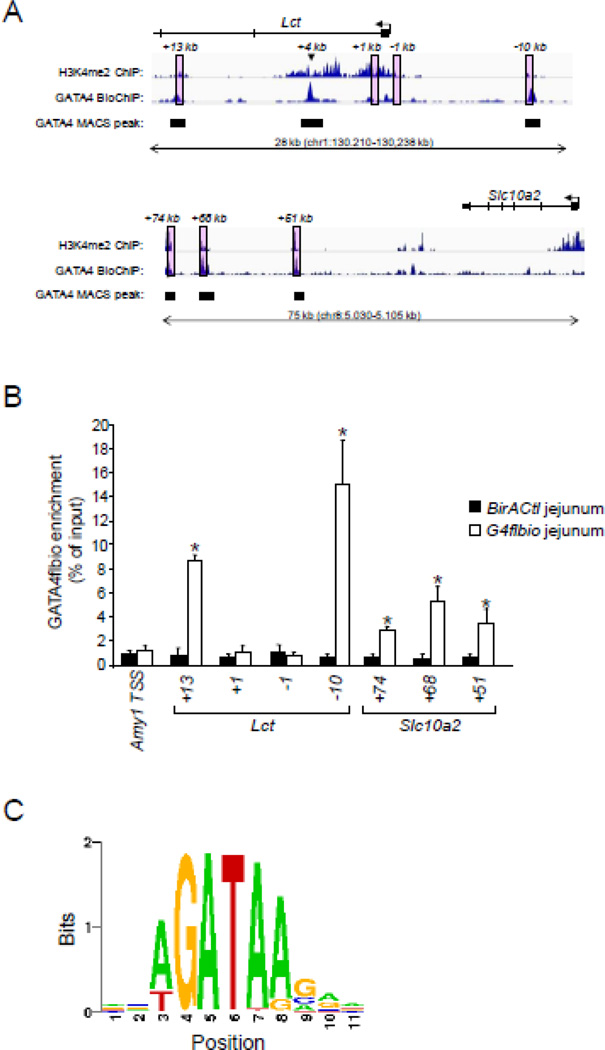
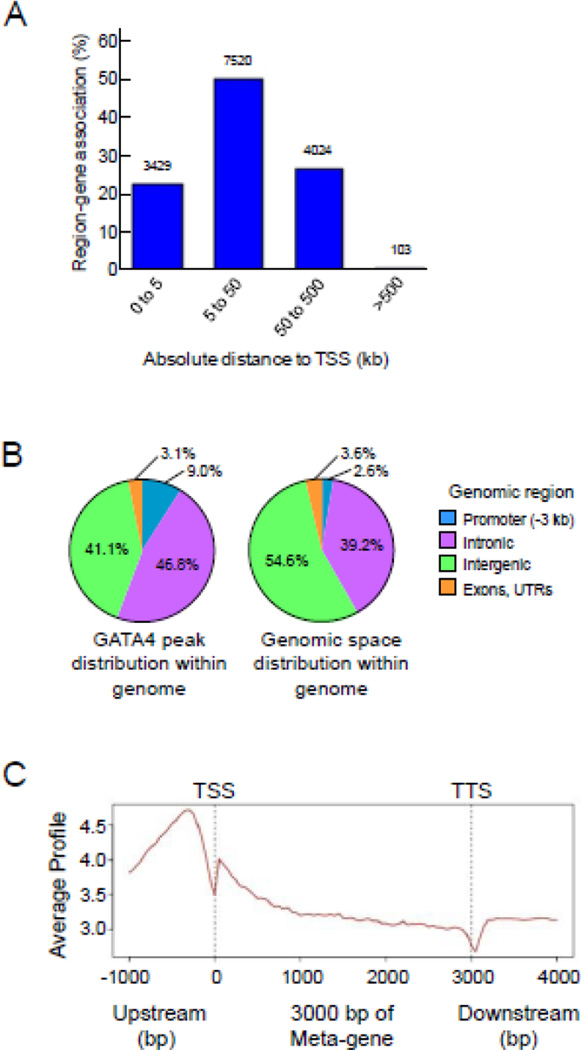
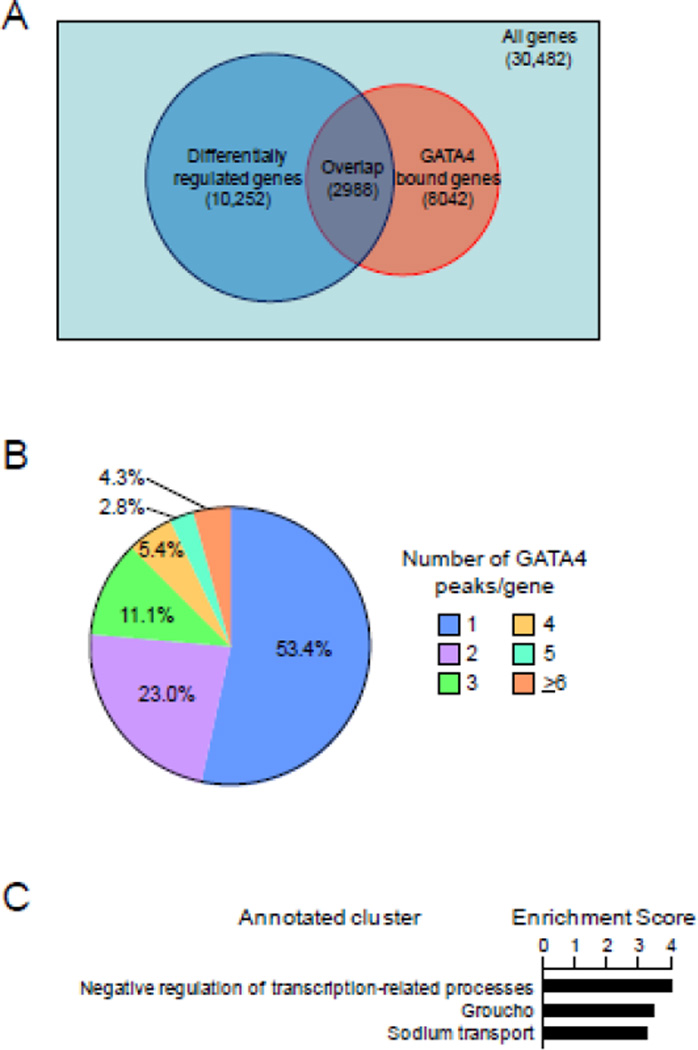
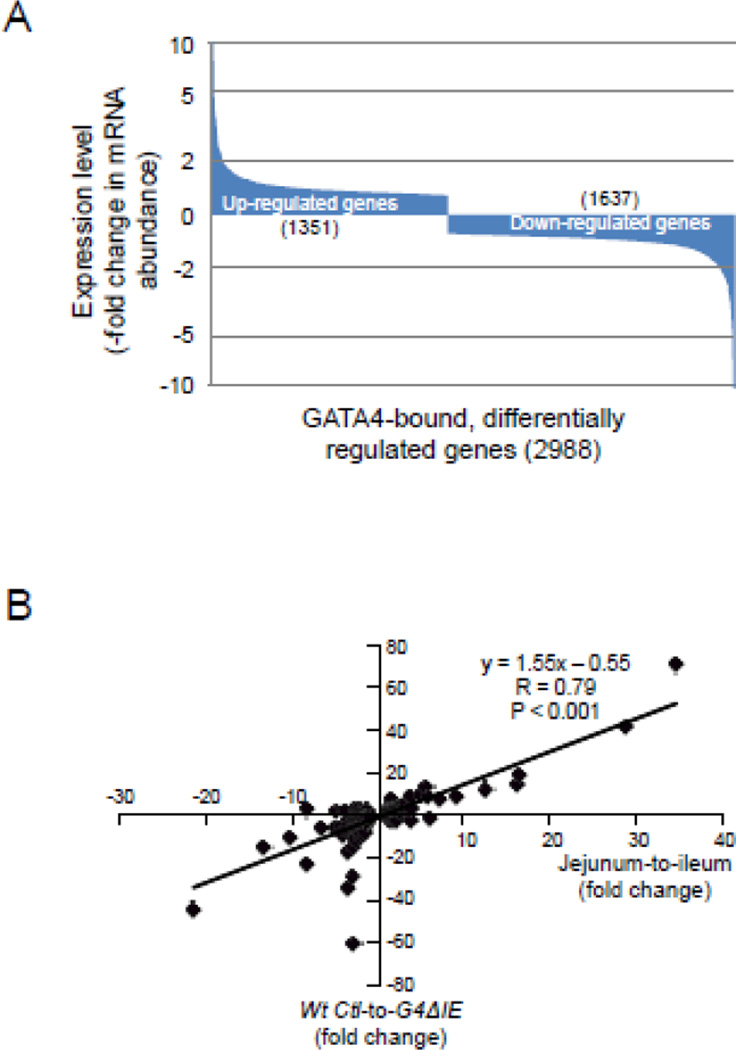
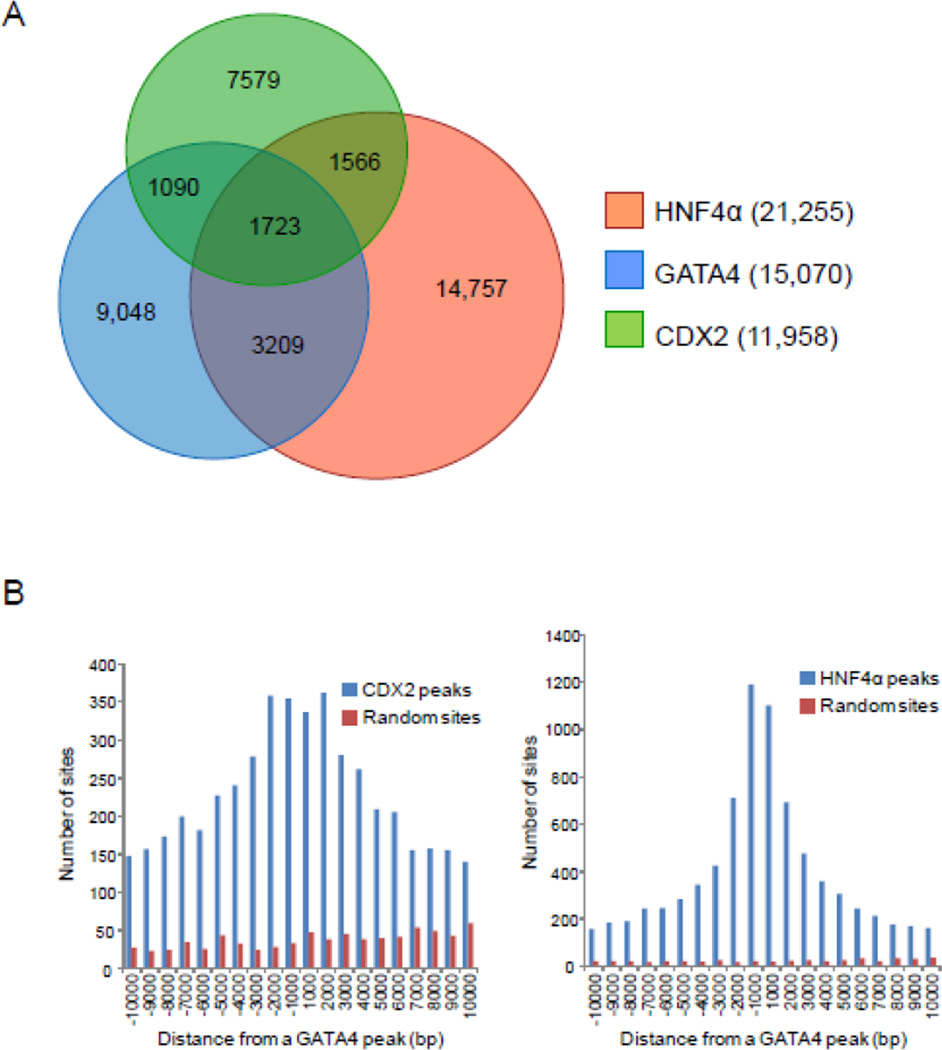
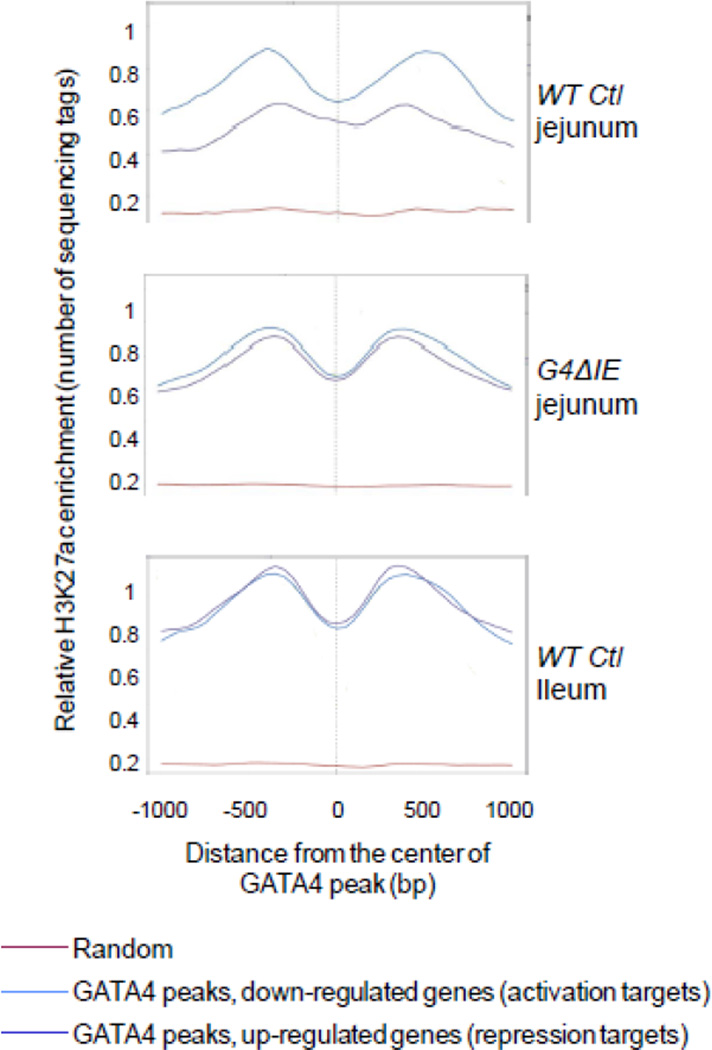
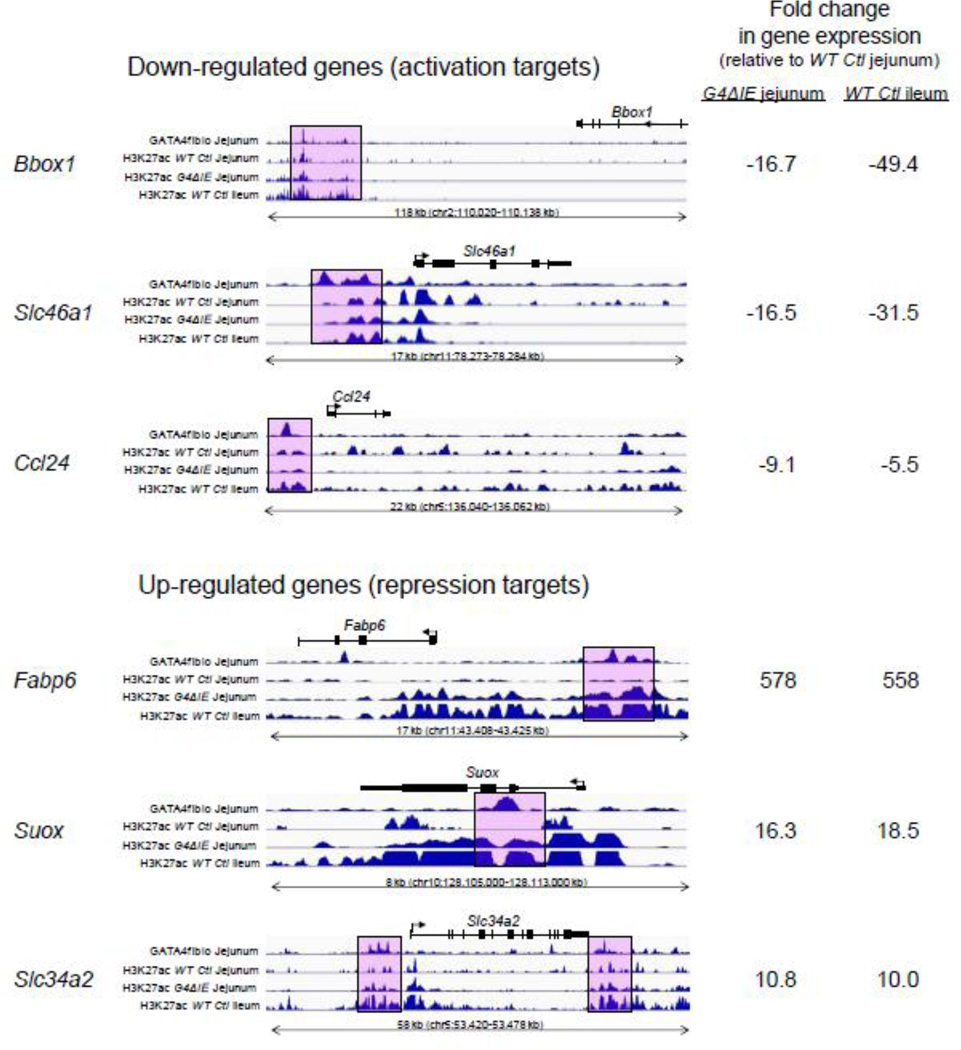
GATA4 is expressed in the proximal 85% of small intestine where it promotes a proximal intestinal ('jejunal') identity while repressing a distal intestinal ('ileal') identity, but its molecular mechanisms are unclear. Here, we tested the hypothesis that GATA4 promotes a jejunal versus ileal identity in mouse intestine by directly activating and repressing specific subsets of absorptive enterocyte genes by modulating the acetylation of histone H3, lysine 27 (H3K27), a mark of active chromatin, at sites of GATA4 occupancy. Global analysis of mouse jejunal epithelium showed a statistically significant association of GATA4 occupancy with GATA4-regulated genes. Occupancy was equally distributed between down- and up-regulated targets, and occupancy sites showed a dichotomy of unique motif over-representation at down- versus up-regulated genes. H3K27ac enrichment at GATA4-binding loci that mapped to down-regulated genes (activation targets) was elevated, changed little upon conditional Gata4 deletion, and was similar to control ileum, whereas H3K27ac enrichment at GATA4-binding loci that mapped to up-regulated genes (repression targets) was depleted, increased upon conditional Gata4 deletion, and approached H3K27ac enrichment in wild-type control ileum. These data support the hypothesis that GATA4 both activates and represses intestinal genes, and show that GATA4 represses an ileal program of gene expression in the proximal small intestine by inhibiting the acetylation of H3K27.

Keywords: Chromatin occupancy; GATA4; H3K27ac; Histone modification; Intestinal epithelium; Transcriptional repression.


Figures

Fig. 1
Fig. 1
GATA4flbio is expressed at near endogenous levels, efficiently biotinylated, and functional in jejunal epithelium of G4flbio mice. (A) Gata4 mRNA abundance, determined by qRT-PCR using mouse Gata4 cDNA primers (mean ± SD, n = 4 in each group), and (B) Western blot analysis using a GATA4 antibody shows that Gata4 is expressed at near endogenous levels in mouse epithelial cells of G4flbio mice as compared to BirA Ctl mice. (C) Streptavidin-biotin pull-down assays showing efficient pull-down of GATA4flbio from nuclear extracts of jejunal epithelium fromG4flbio mice. GATA4flbio was detected by Western analysis using a GATA4 antibody. Input is the extracts isolated from G4flbio mice that have not undergone biotin-streptavidin pull-down, and represents 10% of that used in the pull-down assay. (D) Messenger RNA abundance of the Gata4 target genes, Lct and Slc10a2, in G4flbio mice reveals no difference in gene expression from BirA Ctl mice, demonstrating that GATA4flbio is functional. As a control for impaired GATA4 function, G4ΔIE mice demonstrate the expected down-regulation and up-regulation of Lct and Slc10a2, respectively. Data are shown as mean ± SD, n = 4 in each group.
Fig. 2
Fig. 2
GATA4 occupies chromatin loci in H3K4me2-enriched regions that map to the GATA4 target genes Lct and Slc10a2. (A) Sequencing tag density (revealed as Integrated Genome Browser (IGV) traces) of H3K4me2 and GATA4flbio enrichment in the lactase (Lct) and solute carrier family 10, member 2 (Slc10a2) genes. H3K4me2 enrichment was obtained from publicly available data[25], and GATA4flbio occupancy was determined by BioChIP-seq analysis as described in Methods. The statistically significant called MACS peaks are shown as filled boxes. The pink boxes indicate H3K4me2-enriched loci that contain at least one WGATAR motif. Locations are shown relative to the transcription start site (TSS) (+1 bp) above the pink boxes. One called GATA4flbio peak in Lct not within a pink box is indicated with an arrowhead (+4 kb). (B) Enrichment of GATA4flbio in H3K4me2-enriched loci containing WGATAR motifs by qPCR. BioChIP with qPCR quantification was conducted on jejunal epithelium of BirA Ctl and G4flbio mice as described in Methods. Sites analyzed are those in the pink boxes in (A). The TSS of Amy1, a gene that is not expressed in intestinal epithelium, was used as a negative control. All data are expressed relative to the mean of the BirA Ctl of the Amy1 TSS. Data are represented as mean ± SD from four independent experiments each from four individual mice (mice were also independent of those used for BioChip-seq in (A)). *P<0.05, as compared to BirA Ctl. (C) Sequencing logo plot showing that (A/T)GATA(A/G) is the most highly represented motif within GATA4-occupancy sites.
Fig. 3
Fig. 3
Genome-wide distribution of GATA4 occupancy in chromatin from mouse jejunal epithelium. (A) Distribution of GATA4 occupancy relative to its nearest transcription start site (TSS), shown as absolute distance from the TSS, as determined using the Genomic Region Enrichment Annotation Tool (GREAT)[30]. (B) Distribution of GATA4 occupancy within genomic space, as determined by Cis-Regulatory Element Annotation System (CEAS) [29]. Promoter is defined as 3 kb upstream of the TSS; Intronic is introns; Intergenic is all regions that do not include the promoter (−3 kb from TSS), introns, exons, or untranslated regions (UTRs); Exons, UTRs are also shown. (C) Meta-analysis of GATA4 enrichment level across specific genomic regions was determined using the Cis-Regulatory Element Annotation System (CEAS)[29].
Fig. 4
Fig. 4
GATA4 occupancy is associated with GATA4-regulated genes. (A) Overlap of differentially regulated genes with GATA4 bound genes. A GATA4 bound gene is defined as a gene that has one or more peaks mapped to it, regardless of the peak-to-gene distance. A differentially regulated gene is defined as one that significantly changes at least 1.1-fold when Gata4 is conditionally deleted in the small intestine[3]. The distribution of GATA4 peaks was significantly different from that which would be expected if the distribution were random (P<10−16, Fisher’s exact test). (B) Distribution of peaks to differentially regulated, GATA4-bound genes, segmented by number of allocated peaks per gene reveals a subset of genes with multiple GATA4 peaks. (C) Gene ontology (GO) analysis of genes with 6 or more GATA4 peaks associated with them. The enrichment score is defined as the geometric average of Expression Analysis Systematic Explorer (EASE) scores (modified Fisher exact tests) of the individual GO groups in the cluster[57].
Fig. 5
Fig. 5
GATA4 occupies both activated and repressed target genes. (A) Distribution of up-regulated and down-regulated, GATA4 bound genes. Genes are distributed from the most up-regulated to the most down-regulated. A change of 2-fold and 5-fold (up or down) is indicated by dotted lines. (B) Correlation of GATA4 regulation of direct targets with jejuno-ileal differences in gene expression. Fold changes in mRNA abundance of the 2988 GATA4-bound, differentially regulated genes were plotted against the publicly available[3] fold changes from jejunum-to-ileum of the same gene set.
Fig. 6
Fig. 6
GATA4 co-occupies multiple sites with CDX2 and HNF4α. (A) Overlap of GATA4, CDX2, and HNF4α binding in intestinal epithelium from WT Ctl jejunum, determined by ChIP-seq peaks called at a P-value of <10−5 and a false discovery rate (FDR) <5%. Occupancy was obtained from publicly available CDX2[25] and HNF4α[41] ChIP-seq data from mouse jejunum, and our GATA4 BioChIP-seq analysis. (B) Histogram depicting the frequency at which CDX2 (left) or HNF4α (right) ChIP-seq peaks appear within 1 kb windows of the indicated distance from the summit of a GATA4 peak. CDX2 and HNF4α (blue bars) bind near the summit of GATA4 peaks; such clustering is not evident for GATA4 and random genomic regions equal in number and length to CDX2 or HNF4α binding sites (red bars).
Fig. 7
Fig. 7
Loss of GATA4 in intestinal epithelium promotes the acetylation of H3K27 at GATA4 peaks mapped to repression targets. Using SitePro, a tool embedded in the Cistrome pipeline[29], H3K27ac enrichment was determined across 2000 bp centered on sites of GATA4 occupancy (GATA4 peak) at loci mapped to genes down-regulated by conditional Gata4 deletion (activation targets, blue line), and genes up-regulated by conditional Gata4 deletion (repression targets, purple line). In order to control for variability across ChIP-seq experiments, H3K27ac enrichment was determined in a subset of random genomic loci (red line) as a negative control. H3K27ac enrichment at all TSSs in the genome was used as a positive control to normalize the data. H3K27ac enrichment patterns are shown for wild-type (WT Ctl) jejunum (top panel), conditional Gata4 knockout (G4ΔIE) jejunum (middle panel), and WT Ctl ileum (bottom panel).
Fig. 8
Fig. 8
Individual genes show H3K27ac enrichment patterns similar to genome-wide enrichment patterns. (A) Fold change of selected genes from profiling data of GATA4 knockout-WT and jejuno-ileal differences[3]. ChIP-seq traces at gene loci of down-regulated (B) and up-regulated (C) genes. Pink boxes indicate selected, called GATA4 peaks. Integrated Genome Browser (IGV) races for GATA4 in WT Ctl jejunum, and for H3K27ac in WT Ctl and G4ΔIE jejunum and WT Ctl ileum are shown.

References

    1. Heintzman ND, Ren B. Finding distal regulatory elements in the human genome. Curr Opin Genet Dev. 2009;19(6):541–549. - PMC - PubMed
    1. Bosse T, Piaseckyj CM, Burghard E, Fialkovich JJ, Rajagopal S, Pu WT, Krasinski SD. Gata4 is essential for the maintenance of jejunal-ileal identities in the adult mouse small intestine. Mol Cell Biol. 2006;26(23):9060–9070. - PMC - PubMed
    1. Battle MA, Bondow BJ, Iverson MA, Adams SJ, Jandacek RJ, Tso P, Duncan SA. GATA4 is essential for jejunal function in mice. Gastroenterology. 2008;135(5):1676–1686. e1671. - PMC - PubMed
    1. Beuling E, Kerkhof IM, Nicksa GA, Giuffrida MJ, Haywood J, aan de Kerk DJ, Piaseckyj CM, Pu WT, Buchmiller TL, Dawson PA, et al. Conditional Gata4 deletion in mice induces bile acid absorption in the proximal small intestine. Gut. 2010;59(7):888–895. - PMC - PubMed
    1. van Wering HM, Bosse T, Musters A, de Jong E, de Jong N, Hogen Esch CE, Boudreau F, Swain GP, Dowling LN, Montgomery RK, et al. Complex regulation of the lactase-phlorizin hydrolase promoter by GATA-4. Am J Physio Gastrointest Liver Physiol. 2004;287(4):G899–G909. - PubMed

Publication types