. 2014 May 30;9(5):e98652.
doi: 10.1371/journal.pone.0098652. eCollection 2014.

The effect of tuning cold plasma composition on glioblastoma cell viability

Affiliations

The effect of tuning cold plasma composition on glioblastoma cell viability

Xiaoqian Cheng et al. PLoS One. .

Abstract

Previous research in cold atmospheric plasma (CAP) and cancer cell interaction has repeatedly proven that the cold plasma induced cell death. It is postulated that the reactive oxygen species (ROS) and reactive nitrogen species (RNS) play a major role in the CAP cancer therapy. In this paper, we seek to determine a mechanism of CAP therapy on glioblastoma cells (U87) through an understanding of the composition of the plasma, including treatment time, voltage, flow-rate and plasma-gas composition. In order to determine the threshold of plasma treatment on U87, normal human astrocytes (E6/E7) were used as the comparison cell line. Our data showed that the 30 sec plasma treatment caused 3-fold cell death in the U87 cells compared to the E6/E7 cells. All the other compositions of cold plasma were performed based on this result: plasma treatment time was maintained at 30 s per well while other plasma characteristics such as voltage, flow rate of source gas, and composition of source gas were changed one at a time to vary the intensity of the reactive species composition in the plasma jet, which may finally have various effect on cells reflected by cell viability. We defined a term "plasma dosage" to summarize the relationship of all the characteristics and cell viability.


Conflict of interest statement

Competing Interests: The authors have declared that no competing interests exist.

Figures

Figure 1
Figure 1
(a) The cold plasma device setup: voltage supply, control box, plasma head, and flow meter. (b) The extension tube was attached on the nozzle to eliminate the sparks near the central electrode. Optical probe was placed in front of the extension at a distance of ∼2.5 cm, same as the real treatment distance between the plasma nozzle and the cells (c) Schematic image of the CAP device.
Figure 2
Figure 2. Typical spectrum of helium plasma jet (measured at output of 3.16 kV and helium flow rate at 4.7 l/min).
The determination of major reactive species is shown.
Figure 3
Figure 3
(a) The increase in output voltage from 2.56 to 3.8 kV led to the corresponding rise in the intensity of each species. (b) A closer look at the increasing trend of major ROS and RNS species with voltage increasing. (c) The increasing of each species is proportionally to the output voltage increasing from 2.56 to 3.8 kV when normalized to He (706 nm).
Figure 4
Figure 4
(a) 24, 48, 72 h MTT assay results of U87 treated with 5–60 s duration of helium plasma jet. (b) 24, 48, 72 h MTT assay results of E6/E7 treated with 5–60 s duration of helium plasma jet.
Figure 5
Figure 5
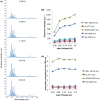
(a) The spectrum of helium plasma jet with flow rate of 2.0, 4.7 and 6.34 l/min. (b) The trend of major RNS and ROS with helium flow rate change at 2.0, 4.7, and 6.4 l/min.
Figure 6
Figure 6. 24, 48, 72–6.34 l/min helium flow rate.
Figure 7
Figure 7. Intracellular peroxynitrite intensity measured in U87 after plasma treatment with various helium flow rate.
Measurement was performed at 1-plasma treatment.
Figure 8
Figure 8
(a) Comparison between spectrum of He/O2 mixture plasma jet and He plasma jet at output voltage 3.16 kV. (b) The trend of major plasma generated RNS and ROS with oxygen volume fraction change at 0, 0.21, 0.42, 0.63%.
Figure 9
Figure 9. 24, 48, 72–0.63% oxygen fractions in the He/O2 mixture gas.
Figure 10
Figure 10
(a) Intracellular ROS generation in U87 cells under 0–60 s plasma treatment durations. Images were taken 30 min after the plasma treatment. (b) Quantification of the ROS intensity with Zen 2012 Lite.
Figure 11
Figure 11. Dependence of cell viability dependence on “plasma dosage” (dash line: E6/E7 cell viability trendline of 24, 48, 72 h incubation after plasma treatment; solid line: U87 viability trendline of 24, 48, 72 h incubation after plasma treatment).

References

    1. Keidar M, Isak Beilis (2013) Plasma Engineering: Application in Aerospace, Nanotechnology and Bionanotechnology. 1st ed. Elsevier BV.
    1. Yousfi M, Merbahi N, Pathak A, Eichwald O (2014) Low-temperature plasmas at atmospheric pressure: toward new pharmaceutical treatments in medicine. Fundam Clin Pharmacol 28: 123–135. - PubMed
    1. Kalghatgi S, Kelly CM, Cerchar E, Torabi B, Alekseev O, et al. (2011) Effects of non-thermal plasma on mammalian cells. PLoS One 6: e16270. - PMC - PubMed
    1. Shashurin A, Keidar M, Bronnikov S, Jurjus RA, Stepp MA (2008) Living tissue under treatment of cold plasma atmospheric jet. Appl Phys Lett 93: 181501.
    1. Nehra V, Kumar A, Dwivedi H (2008) Atmospheric non-thermal plasma sources. Int J Eng 2: 53–68.

Publication types