. 2014 Jul 18;289(29):20295-306.
doi: 10.1074/jbc.M114.554691. Epub 2014 May 30.

Role of 6-O-sulfated heparan sulfate in chronic renal fibrosis

Affiliations

Role of 6-O-sulfated heparan sulfate in chronic renal fibrosis

Abd A Alhasan et al. J Biol Chem. .

Abstract

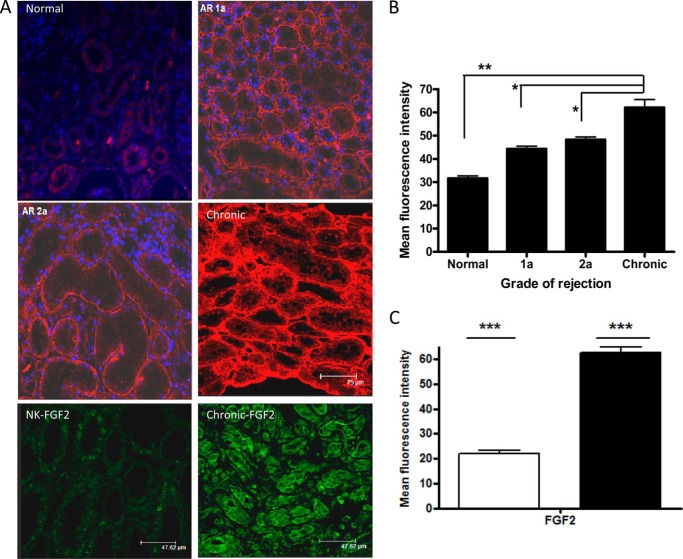
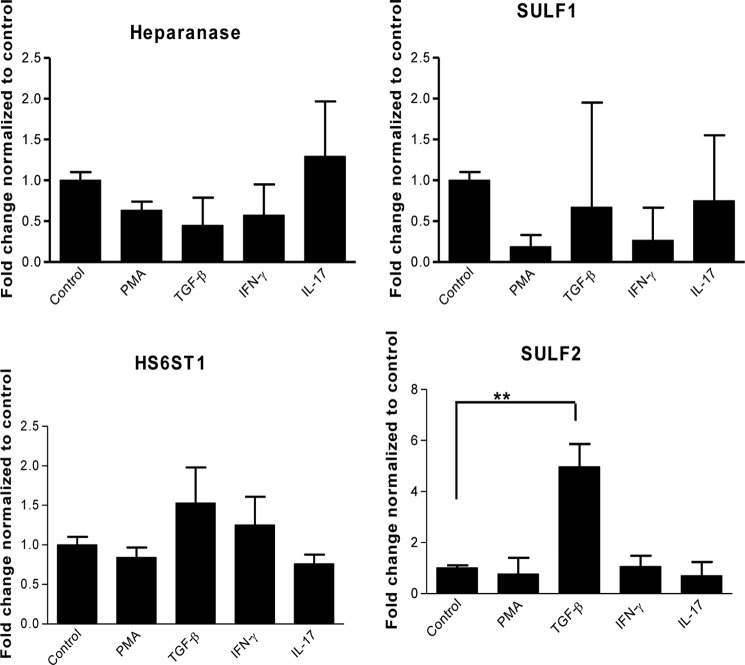
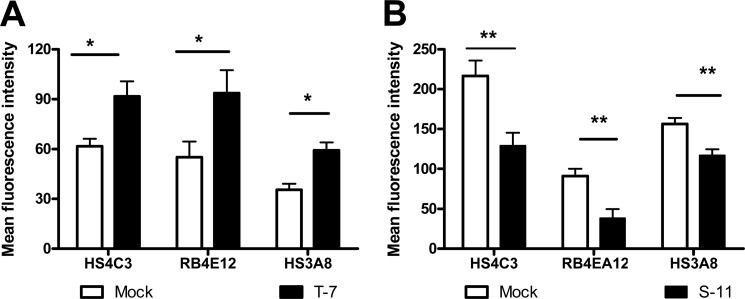
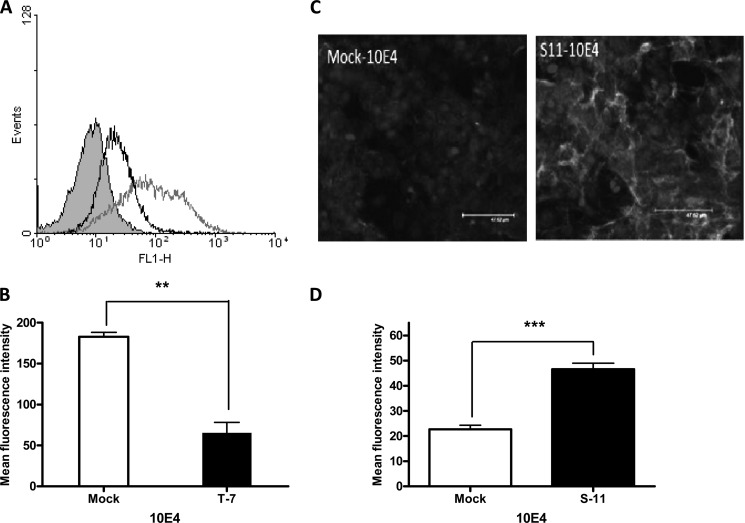
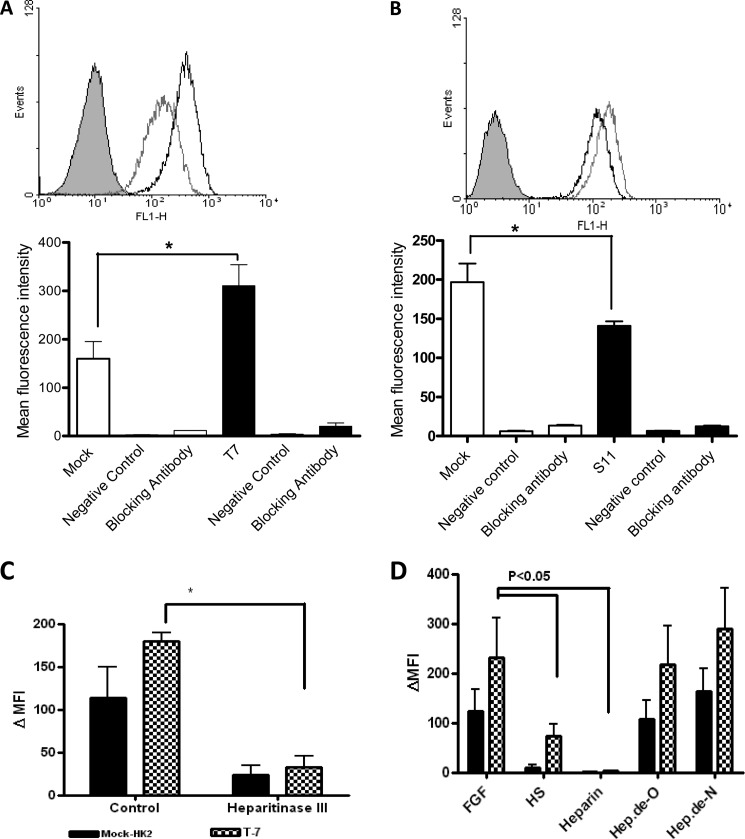
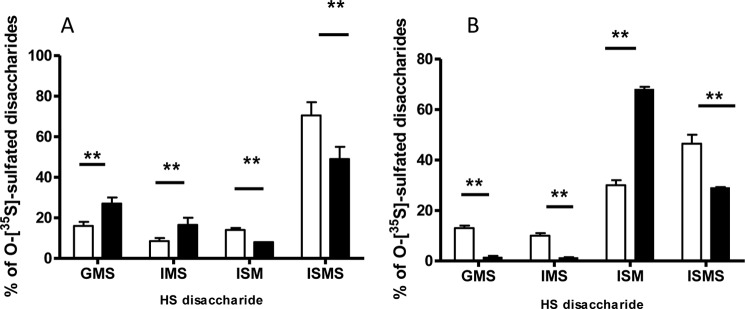
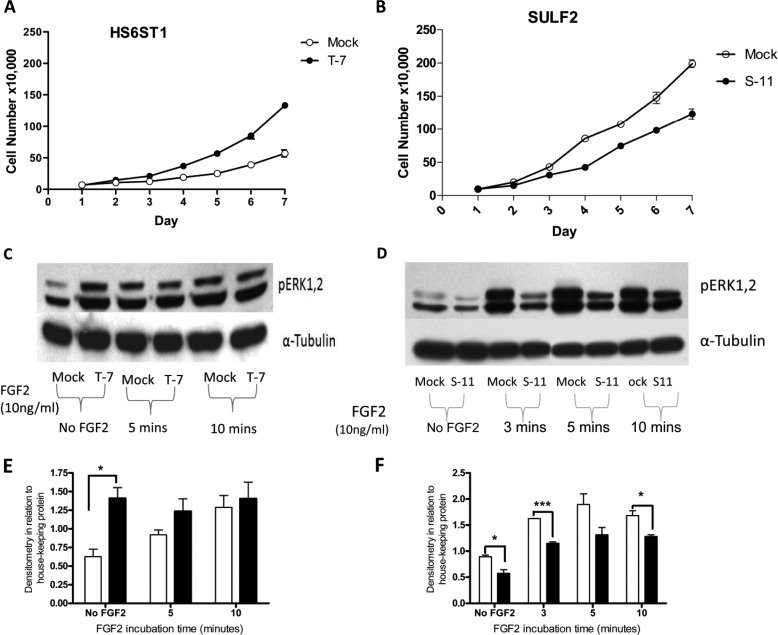
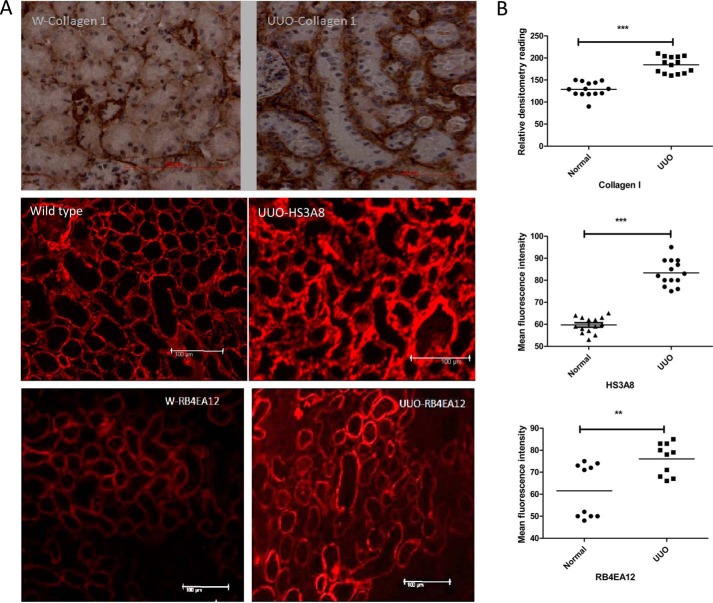
Heparan sulfate (HS) plays a crucial role in the fibrosis associated with chronic allograft dysfunction by binding and presenting cytokines and growth factors to their receptors. These interactions critically depend on the distribution of 6-O-sulfated glucosamine residues, which is generated by glucosaminyl-6-O-sulfotransferases (HS6STs) and selectively removed by cell surface HS-6-O-endosulfatases (SULFs). Using human renal allografts we found increased expression of 6-O-sulfated HS domains in tubular epithelial cells during chronic rejection as compared with the controls. Stimulation of renal epithelial cells with TGF-β induced SULF2 expression. To examine the role of 6-O-sulfated HS in the development of fibrosis, we generated stable HS6ST1 and SULF2 overexpressing renal epithelial cells. Compared with mock transfectants, the HS6ST1 transfectants showed significantly increased binding of FGF2 (p = 0.0086) and pERK activation. HS6ST1 transfectants displayed a relative increase in mono-6-O-sulfated disaccharides accompanied by a decrease in iduronic acid 2-O-sulfated disaccharide structures. In contrast, SULF2 transfectants showed significantly reduced FGF2 binding and phosphorylation of ERK. Structural analysis of HS showed about 40% down-regulation in 6-O-sulfation with a parallel increase in iduronic acid mono-2-O-sulfated disaccharides. To assess the relevance of these data in vivo we established a murine model of fibrosis (unilateral ureteric obstruction (UUO)). HS-specific phage display antibodies (HS3A8 and RB4EA12) showed significant increase in 6-O-sulfation in fibrotic kidney compared with the control. These results suggest an important role of 6-O-sulfation in the pathogenesis of fibrosis associated with chronic rejection.

Keywords: Fibroblast Growth Factor (FGF); Fibrosis; Heparan Sulfate; Sulfotransferase; Transplantation.


Figures

FIGURE 1.
FIGURE 1.
Changes in HS3A8 epitope and FGF expression during renal rejection. A, immunohistochemistry of HS in kidney sections. Heavily sulfated HS was visualized with HS3A8 antibody and a Cy3-labeled secondary antibody. DAPI was used for nuclear counterstain. Kidney sections are representative for the indicated stages of rejection (acute rejection 1a, acute rejection 2a, chronic rejection) with normal tissue as control. The bottom two panels show representative stainings with FGF2 antibody and visualized with FITC-conjugated secondary antibody. B, quantification of the mean fluorescence intensity associated with the expression of HS3A8 epitope during various stages of renal rejection. C, quantification of the mean fluorescence intensity associated with the expression of FGF of normal (clear bar) and chronically rejected kidneys (filled). Five random fields per biopsy were analyzed using Image-J software. Results represent data from 15 patients in total (5 healthy, 3 acute rejection 1a, 2 acute rejection 2a, and 5 chronic rejection).
FIGURE 2.
FIGURE 2.
Gene expression levels of HS modifying enzymes after cytokine stimulation. Renal epithelial cells were incubated with IFN-γ (25 ng/ml), TGF-β (10 ng/ml), IL-17 (100 ng/ml), and phorbol 12-myristate 13-acetate (PMA; 50 ng/ml) for 24 h, and RNA was extracted and converted to cDNA, which was used in quantitative PCR. Relative transcript abundance was normalized to endogenous control GAPDH Three independent experiments (n = 3) were performed in duplicate (n = 2).
FIGURE 3.
FIGURE 3.
HS-specific phage display antibody binding to stable transfectants. Mock and HS6ST1/SULF2 transfectants (A and B, respectively) were incubated on ice with HS3A8, HS4C3, or RB4EA12 antibody at 1:10 dilution followed by Cy3-labeled anti-VSV secondary antibodies. Fluorescence was measured by flow cytometry, and experiments were performed in duplicate (n = 2 and n = 3, *, p < 0.05; **, p < 0.01).
FIGURE 4.
FIGURE 4.
Changes in 10E4 epitopes in stable transfectants. A, flow cytometric analysis of 10E4 antibody binding to HS6ST1 transfected cells (black), mock transfectants (gray), and isotype incubated cells (shaded gray). FL1-H, fluorescence 1-height. B, data were quantified using mean fluorescence intensity measured by flow cytometry, and statistics were performed using t tests for unpaired values. C, immunofluorescence staining of SULF2 transfectants with 10E4 antibody. Cells were grown on chamber slides and stained with 10E4 antibody, and expression was visualized by staining with a FITC-conjugated secondary antibody followed by scanning laser confocal microscopy. D, SULF2 transfectant binding to 10E4 antibody was analyzed using Image J software and Prism 4. (**, p < 0.01; ***, p < 0.001). The results are representative of three independent experiments.
FIGURE 5.
FIGURE 5.
Stable transfectants interaction with FGF2. Representative histograms of flow cytometry of FGF2 binding to HS6ST1 (A) and SULF2 (B) transfectants. Mock, HS6ST1, and SULF2 transfectants were incubated with biotinylated FGF2 (570 ng/ml) for 60 min at 4 °C. Binding was visualized by adding FITC-avidin and analyzed by flow cytometry. The specificity of binding was verified by incubating cells with unrelated biotinylated soya bean protein (negative control) and an FGF2 blocking antibody. The shaded gray histogram represents control cells with avidin-FITC conjugated substrate; the gray histogram represents mock transfectants, whereas black histograms represent HS6ST1 (A) and SULF2 (B) transfectants. The interaction was investigated by flow cytometry and expressed as mean fluorescence intensity. *, p < 0.05, n = 3 error bars represent the S.E. C, FGF2 binding after incubation with heparitinase III. Mock (filled bar) and HS6ST1 transfectants (patterned bar) were incubated with heparitinase III (10 units/ml) for 60 min at 37 C. Cells were subsequently incubated with biotinylated FGF2. Controls include untreated cells. D, FGF2 binding in the presence of various HS derivatives (500 μg/ml), which were added to Mock and HS6ST1 transfectants cells in the presence of biotinylated FGF2.(n = 3). FL1-H, fluorescence 1-height.
FIGURE 6.
FIGURE 6.
HS disaccharide composition in HS6ST1 and SULF2 transfectants. Mock, HS6ST1 (A), and SULF2 (B) transfectants were incubated with 200 μCi/ml [35S]sulfate for 24 h, and disaccharides, isolated as described under “Materials and Methods,” were separated using a strong anion-exchange HPLC Partisil 10 SAX column. GMS, IMS, ISM, and ISMS correspond to GlcA-GlcNS6S, IdoA-GlcNS6S, IdoA2S-GlcNS, and IdoA2S-GlcNS6S, respectively, in the intact HS chain. Clear bars represent mock cells, whereas black bars represent HS6ST1 or SULF2 transfectants.
FIGURE 7.
FIGURE 7.
Effect of HS6ST1 and SULF2 transfectants on FGF2 signaling. A, representative figure showing proliferation data for HS6ST1 transfectants (T-7). 50,000 cells were seeded in triplicate in 6-well plates with complete media. B, representative figure showing proliferation data for SULF2 transfectants (S-11). 100,000 cells were seeded in triplicate in 6-well plates with complete media. Viable cells (using trypan blue) were counted with Neubauer hemocytometer at the indicated time points (n = 3). Shown is a Western blot with anti-phospho ERK1/2 or α-tubulin of HS6ST1 (C) and SULF2 (D) after induction with 10 ng/ml FGF2 for 0 (3), 5, and 10 min. Quantitation by densitometry of pERK1/2 bands normalized to α-tubulin of HS6ST1 (E) and SULF2 (F) transfectants. Clear bars represent mock transfectants, whereas filled bars represent HS6ST1 or SULF2 transfectants. The analysis were performed using Image J and Prism 4 (n = 3; *, p < 0.05; ***, p < 0.001).
FIGURE 8.
FIGURE 8.
Changes in HS sulfation in murine model of fibrosis. UUO mice were generated. On day 7 the animals were sacrificed, and the kidneys were retrieved. A, frozen section of UUO and unoperated control kidneys were stained with antibodies against collagen-I and HS (HS3A8 and RB4EA12), respectively. Sections stained with collagen antibody (1:50) were visualized by incubating with biotinylated secondary antibody, and color was developed with 3,3-diaminobenzidine solution (brown). HS sulfation was examined using phage display antibodies HS3A8 and RB4EA12 followed by staining with Cy3-conjugated anti-VSV antibody. B, quantitative analysis was performed by measuring the density of tubular and interstitial areas randomly by Image J software (3–5 areas/kidney). Three animals were investigated. ***, p < 0.001; **, p < 0.01.

References

    1. Zeisberg M., Neilson E. G. (2010) Mechanisms of tubulointerstitial fibrosis. J. Am. Soc. Nephrol. 21, 1819–1834 - PubMed
    1. Lindahl U., Kusche-Gullberg M., Kjellén L. (1998) Regulated diversity of heparan sulfate. J. Biol. Chem. 273, 24979–24982 - PubMed
    1. Esko J. D., Selleck S. B. (2002) Order out of chaos: assembly of ligand binding sites in heparan sulfate. Annu. Rev. Biochem. 71, 435–471 - PubMed
    1. Allen B. L., Rapraeger A. C. (2003) Spatial and temporal expression of heparan sulfate in mouse development regulates FGF and FGF receptor assembly. J. Cell Biol. 163, 637–648 - PMC - PubMed
    1. Feyzi E., Saldeen T., Larsson E., Lindahl U., Salmivirta M. (1998) Age-dependent modulation of heparan sulfate structure and function. J. Biol. Chem. 273, 13395–13398 - PubMed

Publication types

MeSH terms

LinkOut - more resources