. 2014 Aug 8;289(32):22205-20.
doi: 10.1074/jbc.M114.572164. Epub 2014 May 30.

A mechanism for the auto-inhibition of hyperpolarization-activated cyclic nucleotide-gated (HCN) channel opening and its relief by cAMP

Affiliations

A mechanism for the auto-inhibition of hyperpolarization-activated cyclic nucleotide-gated (HCN) channel opening and its relief by cAMP

Madoka Akimoto et al. J Biol Chem. .

Abstract

Hyperpolarization-activated cyclic nucleotide-gated (HCN) ion channels control neuronal and cardiac electrical rhythmicity. There are four homologous isoforms (HCN1-4) sharing a common multidomain architecture that includes an N-terminal transmembrane tetrameric ion channel followed by a cytoplasmic "C-linker," which connects a more distal cAMP-binding domain (CBD) to the inner pore. Channel opening is primarily stimulated by transmembrane elements that sense membrane hyperpolarization, although cAMP reduces the voltage required for HCN activation by promoting tetramerization of the intracellular C-linker, which in turn relieves auto-inhibition of the inner pore gate. Although binding of cAMP has been proposed to relieve auto-inhibition by affecting the structure of the C-linker and CBD, the nature and extent of these cAMP-dependent changes remain limitedly explored. Here, we used NMR to probe the changes caused by the binding of cAMP and of cCMP, a partial agonist, to the apo-CBD of HCN4. Our data indicate that the CBD exists in a dynamic two-state equilibrium, whose position as gauged by NMR chemical shifts correlates with the V½ voltage measured through electrophysiology. In the absence of cAMP, the most populated CBD state leads to steric clashes with the activated or "tetrameric" C-linker, which becomes energetically unfavored. The steric clashes of the apo tetramer are eliminated either by cAMP binding, which selects for a CBD state devoid of steric clashes with the tetrameric C-linker and facilitates channel opening, or by a transition of apo-HCN to monomers or dimer of dimers, in which the C-linker becomes less structured, and channel opening is not facilitated.

Keywords: Allosteric Regulation; Allostery; Cyclic AMP (cAMP); HCN; Intrinsically Disordered Proteins (IDPs); Nuclear Magnetic Resonance (NMR); Protein Conformation; Signaling; cAMP-binding Domain (CBD); cCMP.


Figures

FIGURE 1.
FIGURE 1.
Construct design and architecture of cAMP-bound HCN. The linker and CBD regions are displayed in gray and red, respectively. a, sequence alignment of the CBDs of human HCN2 and human HCN4. The location of α-helices and β-strands is shown using red rectangles and arrows, respectively, and was inferred from the crystal structure of cAMP-bound HCN4 (PDB code 3OTF) (22). b, domain organization of the intracellular region of HCN4. The human HCN4(563–724) and (579–707) constructs were investigated by NMR. c, structure of HCN4(563–724) bound to cAMP (PDB code 3OTF) (22). d–f, analytical SEC data of human HCN4. d, effect of dilution on apo-HCN4(563–724). Two different concentrations (100 and 40 μm) were injected in the column. e, apo versus cAMP SEC profiles of HCN4(563–724) injected as a 100 μm solution. f, SEC profile of apo-HCN4(579–707) injected as a 100 μm solution. Analytical SEC was preformed with a Superdex 75 10/30 column (GE Healthcare) at 4 °C. Buffer contained 20 mm MES, pH 6.5, 100 mm KCl, 1 mm DTT with or without 1 mm cAMP. mAU, milli-absorbance unit.
FIGURE 2.
FIGURE 2.
Binding of cAMP to human HCN4(563–724) mapped by STD NMR and chemical shift perturbations. a, binding isotherm for the titration of cAMP into a 10 μm HCN4(563–724) solution monitored through the STD amplification factor (STDaf) normalized to the plateau value and plotted versus the total cAMP concentration. The solid line represents the binding isotherm corresponding to a Kd value of 5 μm, and the dashed lines correspond to Kd values of 1 and 9 μm. b, 1H-15N HSQC spectra of 0.1 mm HCN4(563–724) acquired in the absence (black) and presence (red) of 2.5 mm excess cAMP. Representative peaks are labeled. c, compounded 1H,15N chemical shift (CCS) differences between apo- and cAMP-bound HCN4(563–724) plotted against the residue number. The secondary structure of cAMP-bound HCN4 is reported as dotted lines at the top of this panel. d, map of apo- versus holo-CCS differences onto the structure of cAMP-bound HCN4(563–724) (22). cAMP is shown as black sticks. Residue color code: 0.10 ppm ≤ CCS < 0.25 ppm is shown in brown, 0.25 ppm ≤ CCS < 0.50 ppm in purple, and 0.50 ppm ≤ CCS in red.
FIGURE 3.
FIGURE 3.
Fractional activation by cCMP partial agonist quantified through the comparative chemical shift analysis of apo versus cCMP versus cAMP HCN4(563–724). a and b, representative HSQC cross-peak for HCN4(563–724) in the apo-form and bound to excess cAMP or cCMP (2.5–5.0 mm). c, schematic illustration of the vectors utilized for the projection analysis of NMR chemical shifts. d, compounded chemical shift profile of cCMP relative to apo. e, cos(θ) residue profile. The angle θ is defined in c. f, residue-specific fractional shifts (X) toward activation caused by cCMP binding. X is defined in c. X was computed only for residues with an apo versus cAMP-compounded chemical shift greater than a 0.05 ppm. X values > 1 are off-scale. g, distribution of fractional shifts toward activation from f, computed using the chemical shift projection analysis (33). The experimental distribution was fitted to a gaussian function. h, comparison between the NMR-based average relative % of active state in the cCMP-saturated HCN4(563–724) sample and the ΔV½ voltage changes caused by cCMP binding to full-length HCN4 channels measured through electrophysiology (53).
FIGURE 4.
FIGURE 4.
Secondary structure and picosecond-nanosecond dynamic profile of apo- and cAMP-bound human HCN4(563–724). NMR chemical shift-based secondary structure of HCN4(563–724) in the presence of excess cAMP (a) and in the apo-form (b). Helical and strand probabilities are reported as positive and negative values, respectively. a and b, residues for which HN assignments are not available are flagged with a dot. c, HN-NOE versus residue plot for HCN4(563–724) in the presence of excess cAMP (red) and in the apo-form (black). The circles at the bottom of c denote the presence of fast H/H exchange as indicated by the observation of CLEANEX cross-peaks in the apo-form (empty circles) and in the presence of excess cAMP (red filled circles). d, changes in methyl order parameters (S2) for the region-spanning helices A′–D′ as computed based on the HCN4 structure (chain A of PDB code 3OTF) either as an isolated monomer (filled circles) or assembled as a tetramer (open circles). Computations were executed through the “S2” software (81). These computations do not consider the possible unfolding of the A′–D′-helices upon tetramer dissociation, and therefore it is possible that the experimental order parameters for the monomer are lower than those computed here. e, CCS differences between apo-human HCN4(579–707) and apo-human HCN4(563–724). Dashed lines outline the secondary structure as per the PDB code 3OTF (22).
FIGURE 5.
FIGURE 5.
Proposed structural model for apo-human HCN4(579–707). a, overlay of 10 representative structures of apo-HCN4(579–707) as refined through CS-Rosetta. The ribbon represents the average structure of the ensemble. b, apo (average, orange) versus cAMP-bound (gray and red) CBD comparison. The holo-HCN4 structure was obtained from the PDB code 3OTF (22). Upon cAMP removal, the A-helix rotates around its axis and slightly tilts thus moving the N3A motif closer to the PBC and the β-barrel (N3A in orientation). Unlike the N3A region, the B/C-helices move away from the PBC upon removal of cAMP (B/C out orientation). c, apo (orange) versus holo-N3A overlay, revealing that the cAMP-dependent N3A movement occurs in first approximation as a rigid-body, i.e. the average relative orientation of the helices within the N3A motif does not change significantly upon cAMP binding. The ribbon represents the average structure of the ensemble, similarly to a. d, “hybrid” HCN4 hypothetical model arising from the overlay of the N3A motifs from the active-state IR region (i.e. A′-β segment from the A protomer of the PDB structure 3OTF; linker is in light gray and CBD component is in red) and from the inactive state average structure (i.e. E′-β segment of apo-HCN4(579–707) shown in orange). Helices C′–D′ from an adjacent protomer are shown in dark gray to illustrate the elbow-shoulder inter-molecular contacts that stabilize the tetramer. Surfaces are shown for the IR tetramerization domain residues that in the holo-tetramer are in contact with the β-subdomain, and for the apo-HCN4 structure. The arrow and black jagged oval highlight the site of steric clashes between the apo β-barrel and the IR tetramerization domain, as quantified in Table 2.
FIGURE 6.
FIGURE 6.
Validation of the structural model for apo-human HCN4(579–707). a, experimental versus back-calculated RDC comparison for apo-human HCN4(579–707). The experimental backbone amide RDCs (red dotted line) show overall good agreement with the back-calculated RDCs (blue lines). Black dots represent residues for which cross-peaks were overlapping in the HSQC spectra. b, comparative analysis of the residue-specific local r.m.s.d. and HN-NOE profiles of apo-human HCN4(579–707). The dotted ovals highlight regions corresponding to local maxima and local minima in the r.m.s.d. and HN-NOE values, respectively. The secondary structure is reported as dashed lines. The local r.m.s.d. was computed using the structure bundle shown in Fig. 5a. c, distance distribution for the Me-Me NOEs measured for apo-HCN4(579–707). Histogram showing the number of observed NOEs in apo-HCN4(579–707) for different distance ranges. Methyl-methyl distances have been calculated between methyl carbon atoms. All the observed NOEs correspond to distances less than 8 Å. d, PRE profile for apo-human HCN4(579–707) spin-labeled at Cys-586. The PREs were quantified in terms of relative HSQC intensity attenuations (Iox/Ired; filled circles) and were compared with the average amide distances from the sulfur atom of Cys-586 computed based on the apo-human HCN4(579–707) structures (open circles). The Iox/Ired ratios <0.8 are expected to correlate linearly with distances, unless internal dynamics is present. Significant contributions from spin labels at other Cys sites (i.e. Cys-662 and Cys-679) were ruled out as follows. Cys-679 is well structured (HN-NOE ≥0.8 and its side chain is inaccessible to solvent: the solvent-accessible surface area in the apo-structure is 0 Å2). For Cys-662, the corresponding side chain solvent-accessible surface area is 1 Å2 and, although the HN NOE value for this residue is not available, the profile of amide distances from Cys-662 does not match the experimental intensity data. The dotted ovals indicate local deviations between the PRE ratios and the distances calculated based on the structures, possibly arising from the presence of structural dynamics.
FIGURE 7.
FIGURE 7.
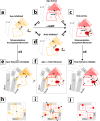
Proposed model for auto-inhibition of HCN4 by the IR, spanning the IR tetramerization domain (i.e. helices A′–D′), shown in gray, the N3Aand the remaining part of the CBD, both shown in either orange (Inhibited) or red (Active). The N3A motif (triangle) is composed of helices E′–F′–A, which are N-terminal to the β-subdomain of the CBD. The CBD includes also helices B–C, which are C-terminal to the β-subdomain and function as a lid for cAMP. The N3A orientation is kept constant in all the panels. Dashed lines denote unfolded or partially unfolded segments. a–d, four-state thermodynamic cycle for the cAMP-dependent allostery of the monomeric HCN4 IR, resulting from the coupling of the cAMP-binding equilibrium (i.e. apo versus holo) and the conformational change equilibrium (i.e. inhibited versus active). e and f, models for the tetrameric HCN4 IR. Dotted lines indicate helices from distinct but adjacent protomers within the tetramer. Tetramerization promotes folding of helices A′–D′. However, the apo-tetramer is unstable due to steric clashes between the β-subdomain and the IR tetramerization domain, which are highlighted as yellow suns. The allosteric conformational transition driven by cAMP binding changes the relative orientation of the N3A and β-subdomain, eliminating the steric clashes that destabilize the apo-tetramer, as shown in g. f illustrates the apo-tetramer versus holo-tetramer comparison. h and j, schemes of the apo (h), holo (j), and apo versus holo (i) HCN4 intracellular region tetramer viewed parallel to the 4-fold axis, denoted by the + sign in the center of each tetramer. Similarly to e–g, yellow suns indicate steric clashes, and red filled ovals represent cAMP molecules.
FIGURE 8.
FIGURE 8.
Proposed models for apo-HCN dimer of dimers. Scheme illustrating why in the apo-HCN dimer the eCBD does not necessarily lead to steric clashes, unlike in the apo-tetramer (Fig. 7, e and h). The color codes are as in Fig. 7. As in Fig. 7, dashed lines denote regions that are only partially structured or unstructured, and dotted rectangles indicate helices belonging to an adjacent protomer. a, stepwise dissociation of the unstable apo-tetramer into dimers, in which the structuring effect of self-association is preserved for only a single elbow-shoulder interface per dimer. The increased linker flexibility in the dimer relative to the tetramer allows the β-subdomain of the CBD to move and relax the steric clashes (suns with “X”), as shown in panels b and c, which correspond to the two different protomers within the dimer.

References

    1. Zagotta W. N., Olivier N. B., Black K. D., Young E. C., Olson R., Gouaux E. (2003) Structural basis for modulation and agonist specificity of HCN pacemaker channels. Nature 425, 200–205 - PubMed
    1. Robinson R. B., Siegelbaum S. A. (2003) Hyperpolarization-activated cation currents: from molecules to physiological function. Annu. Rev. Physiol. 65, 453–480 - PubMed
    1. Trudeau M. C., Zagotta W. N. (2003) Calcium/calmodulin modulation of olfactory and rod cyclic nucleotide-gated ion channels. J. Biol. Chem. 278, 18705–18708 - PubMed
    1. Kaupp U. B., Seifert R. (2002) Cyclic nucleotide-gated ion channels. Physiol. Rev. 82, 769–824 - PubMed
    1. DiFrancesco D., Tortora P. (1991) Direct activation of cardiac pacemaker channels by intracellular cyclic AMP. Nature 351, 145–147 - PubMed

Publication types

MeSH terms

Associated data

LinkOut - more resources