

Olfactory deficits in an alpha-synuclein fly model of Parkinson's disease
- PMID: 24879013
- PMCID: PMC4039441
- DOI: 10.1371/journal.pone.0097758
Olfactory deficits in an alpha-synuclein fly model of Parkinson's disease
Abstract
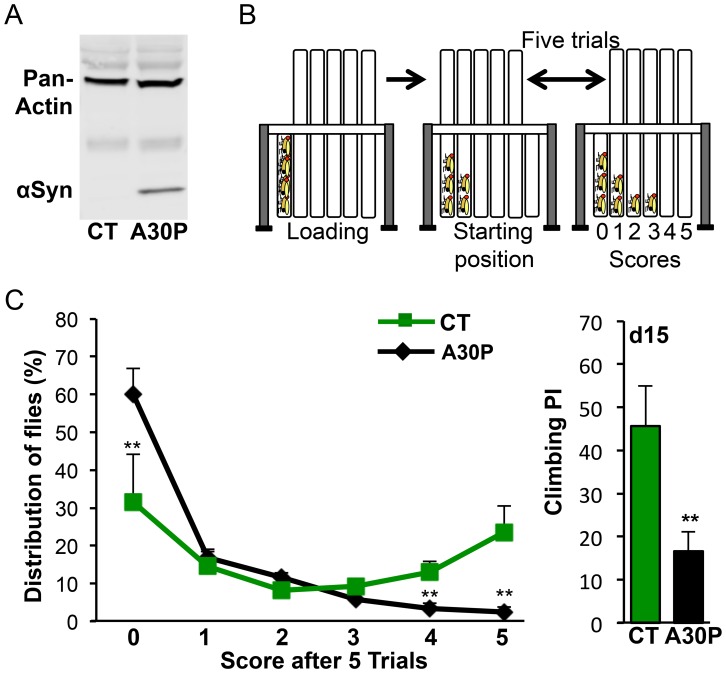
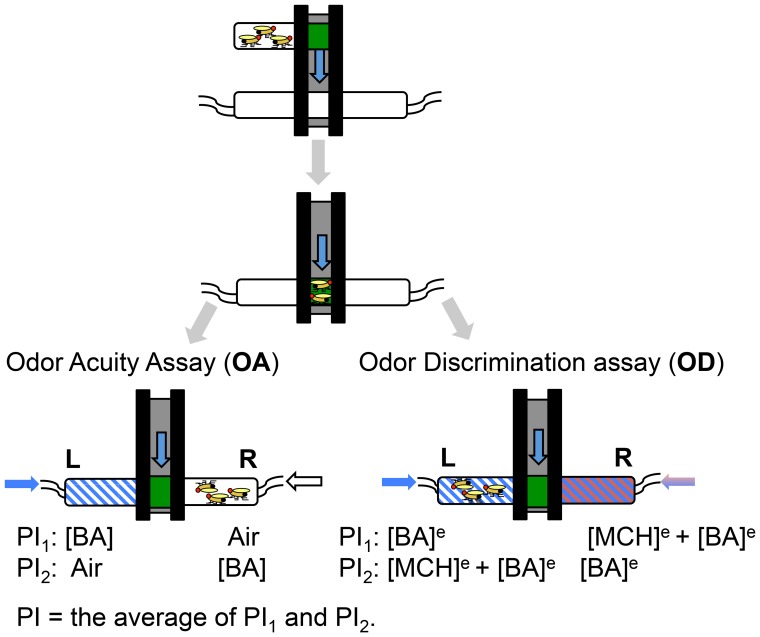
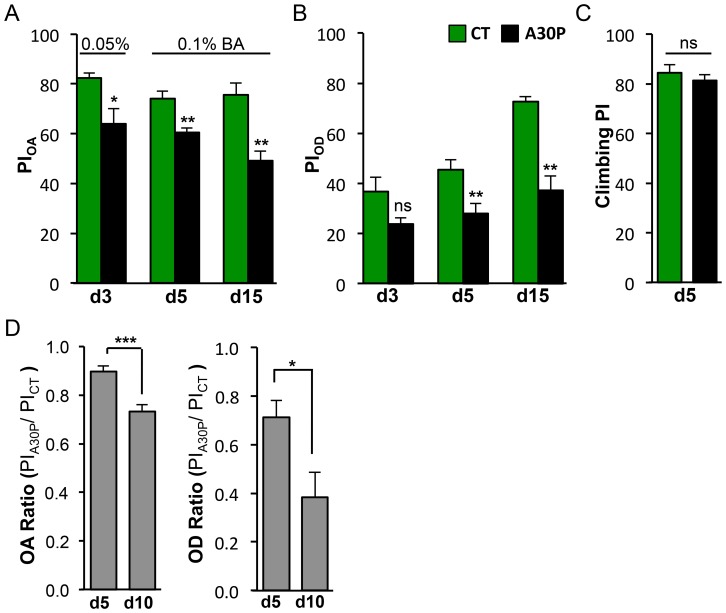
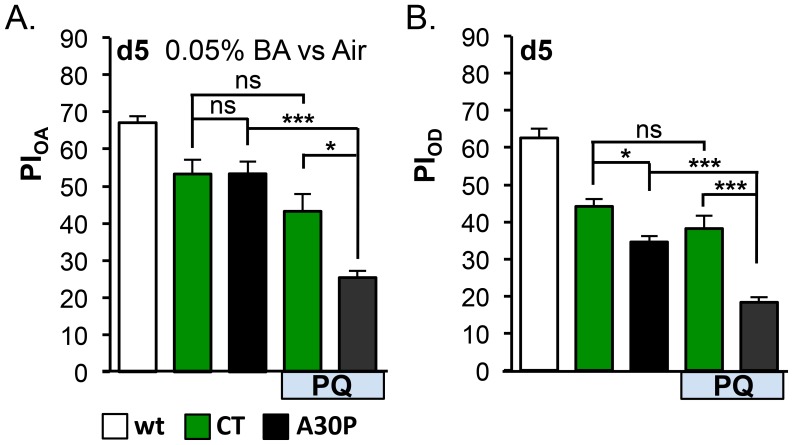
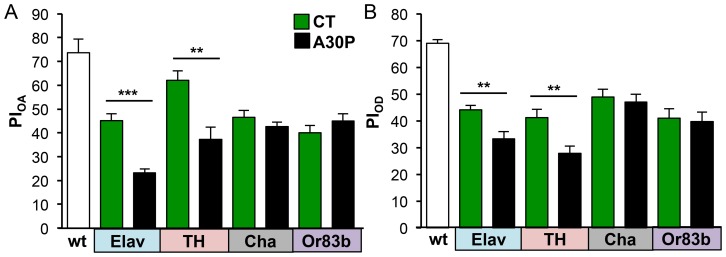
Parkinson's disease (PD) is the most common motor neurodegenerative disorder. Olfactory dysfunction is a prevalent feature of PD. It often precedes motor symptoms by several years and is used in assisting PD diagnosis. However, the cellular and molecular bases of olfactory dysfunction in PD are not known. The fruit fly Drosophila melanogaster, expressing human alpha-synuclein protein or its mutant, A30P, captures several hallmarks of PD and has been successfully used to model PD in numerous studies. First, we report olfactory deficits in fly expressing A30P (A30P), showing deficits in two out of three olfactory modalities, tested--olfactory acuity and odor discrimination. The remaining third modality is odor identification/naming. Second, oxidative stress is an important environmental risk factor of PD. We show that oxidative stress exacerbated the two affected olfactory modalities in younger A30P flies. Third, different olfactory receptor neurons are activated differentially by different odors in flies. In a separate experiment, we show that the odor discrimination deficit in A30P flies is general and not restricted to a specific class of chemical structure. Lastly, by restricting A30P expression to dopamine, serotonin or olfactory receptor neurons, we show that A30P expression in dopamine neurons is necessary for development of both acuity and discrimination deficits, while serotonin and olfactory receptor neurons appeared not involved. Our data demonstrate olfactory deficits in a synuclein fly PD model for exploring olfactory pathology and physiology, and for monitoring PD progression and treatment.
Conflict of interest statement
Figures

Similar articles
-
Walking deficits and centrophobism in an α-synuclein fly model of Parkinson's disease.Genes Brain Behav. 2014 Nov;13(8):812-20. doi: 10.1111/gbb.12172. Epub 2014 Oct 14. Genes Brain Behav. 2014. PMID: 25113870 Free PMC article.
-
Roles of α-Synuclein and Disease-Associated Factors in Drosophila Models of Parkinson's Disease.Int J Mol Sci. 2022 Jan 28;23(3):1519. doi: 10.3390/ijms23031519. Int J Mol Sci. 2022. PMID: 35163450 Free PMC article. Review.
-
A stress-enhanced model for discovery of disease-modifying gene: Ece1-suppresses the toxicity of α-synuclein A30P.Neurobiol Dis. 2018 Jun;114:153-163. doi: 10.1016/j.nbd.2018.03.003. Epub 2018 Mar 7. Neurobiol Dis. 2018. PMID: 29524599
-
A new Drosophila model to study the interaction between genetic and environmental factors in Parkinson's disease.Brain Res. 2014 Oct 2;1583:277-86. doi: 10.1016/j.brainres.2014.08.021. Epub 2014 Aug 15. Brain Res. 2014. PMID: 25130663
-
Reprint of: revisiting oxidative stress and mitochondrial dysfunction in the pathogenesis of Parkinson disease-resemblance to the effect of amphetamine drugs of abuse.Free Radic Biol Med. 2013 Sep;62:186-201. doi: 10.1016/j.freeradbiomed.2013.05.042. Epub 2013 Jun 3. Free Radic Biol Med. 2013. PMID: 23743292 Review.
Cited by
-
Disease model organism for Parkinson disease: Drosophila melanogaster.BMB Rep. 2019 Apr;52(4):250-258. doi: 10.5483/BMBRep.2019.52.4.204. BMB Rep. 2019. PMID: 30545438 Free PMC article. Review.
-
Sensory neuropathy and nociception in rodent models of Parkinson's disease.Dis Model Mech. 2019 Jun 27;12(6):dmm039396. doi: 10.1242/dmm.039396. Dis Model Mech. 2019. PMID: 31248900 Free PMC article. Review.
-
Walking deficits and centrophobism in an α-synuclein fly model of Parkinson's disease.Genes Brain Behav. 2014 Nov;13(8):812-20. doi: 10.1111/gbb.12172. Epub 2014 Oct 14. Genes Brain Behav. 2014. PMID: 25113870 Free PMC article.
-
Roles of α-Synuclein and Disease-Associated Factors in Drosophila Models of Parkinson's Disease.Int J Mol Sci. 2022 Jan 28;23(3):1519. doi: 10.3390/ijms23031519. Int J Mol Sci. 2022. PMID: 35163450 Free PMC article. Review.
-
Exploring therapeutic potential of mitophagy modulators using Drosophila models of Parkinson's disease.Front Aging Neurosci. 2022 Oct 19;14:986849. doi: 10.3389/fnagi.2022.986849. eCollection 2022. Front Aging Neurosci. 2022. PMID: 36337696 Free PMC article. Review.
References
-
- Ansari KA, Johnson A (1975) Olfactory function in patients with Parkinson’s disease. J Chronic Dis 28: 493–497. - PubMed
-
- Hawkes CH, Del Tredici K, Braak H (2010) A timeline for Parkinson’s disease. Parkinsonism Relat Disord 16: 79–84. - PubMed
-
- Ross GW, Petrovitch H, Abbott RD, Tanner CM, Popper J, et al. (2008) Association of olfactory dysfunction with risk for future Parkinson’s disease. Ann Neurol 63: 167–173. - PubMed
-
- Berendse HW, Booij J, Francot CM, Bergmans PL, Hijman R, et al. (2001) Subclinical dopaminergic dysfunction in asymptomatic Parkinson’s disease patients’ relatives with a decreased sense of smell. Ann Neurol 50: 34–41. - PubMed
-
- Doty RL (2012) Olfactory dysfunction in Parkinson disease. Nat Rev Neurol 8: 329–339. - PubMed
Publication types
MeSH terms
Substances
LinkOut - more resources
Full Text Sources
Other Literature Sources
Medical
Molecular Biology Databases
Miscellaneous
