

Repeated sense of hunger leads to the development of visceral obesity and metabolic syndrome in a mouse model
- PMID: 24879081
- PMCID: PMC4039491
- DOI: 10.1371/journal.pone.0098276
Repeated sense of hunger leads to the development of visceral obesity and metabolic syndrome in a mouse model
Abstract
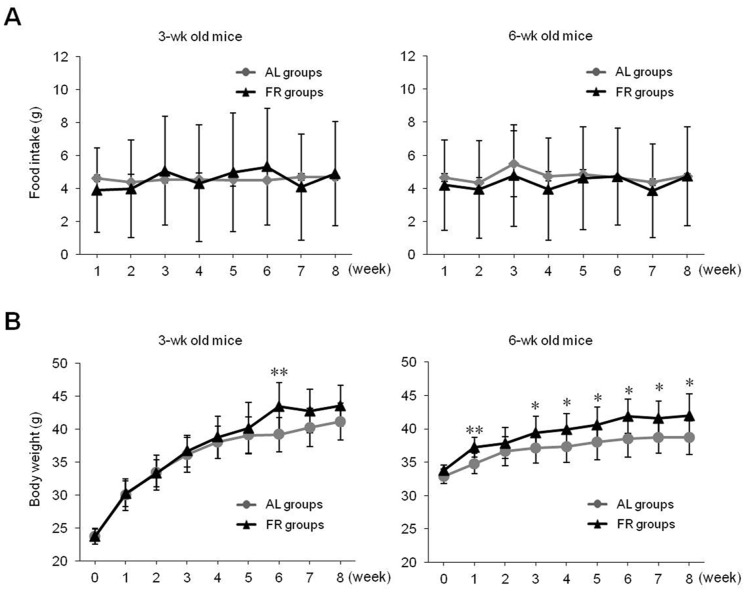
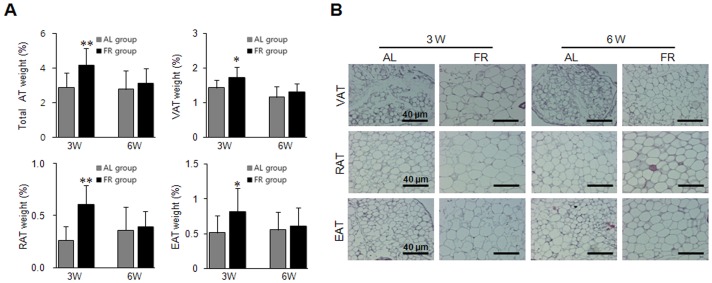
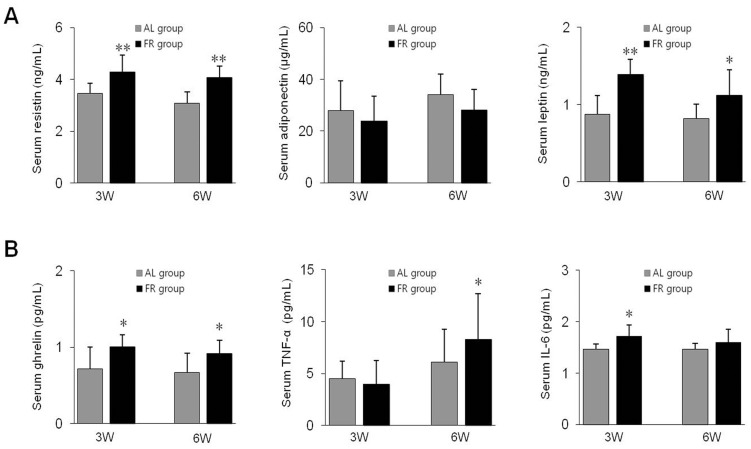
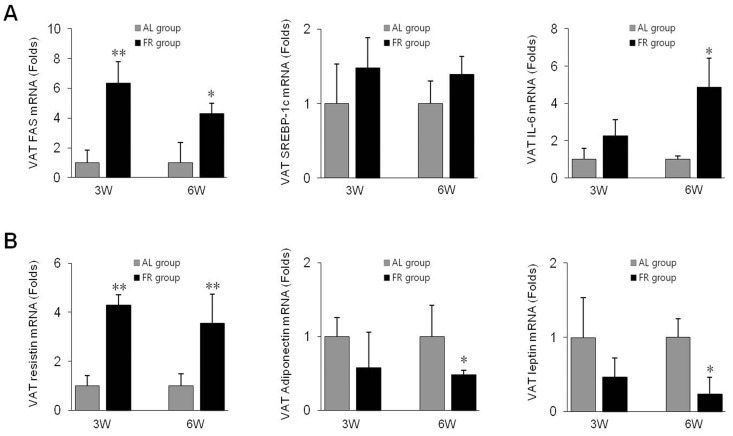
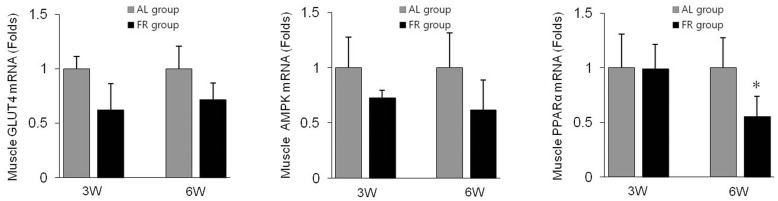
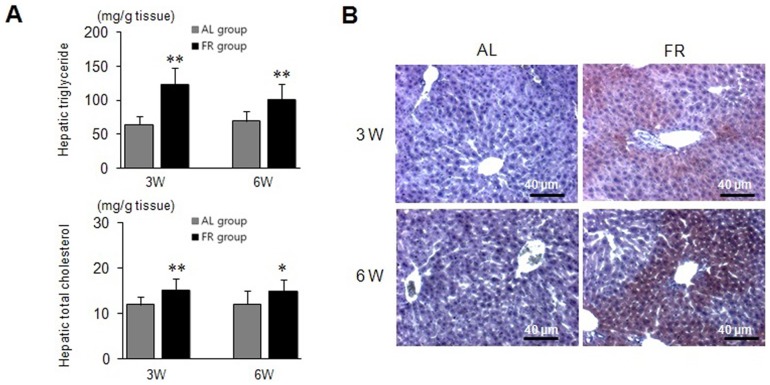
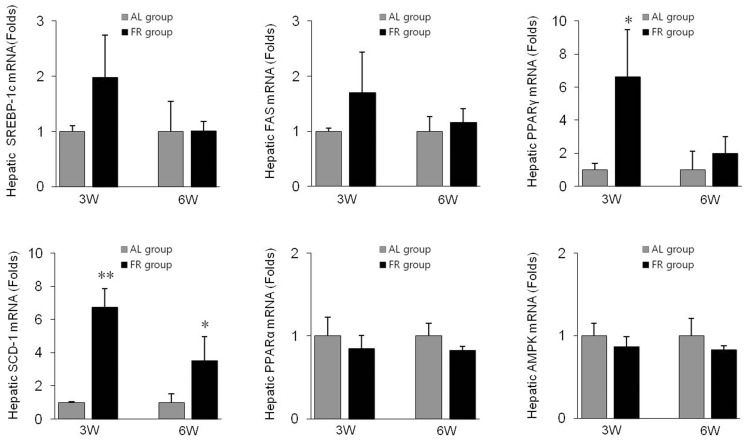
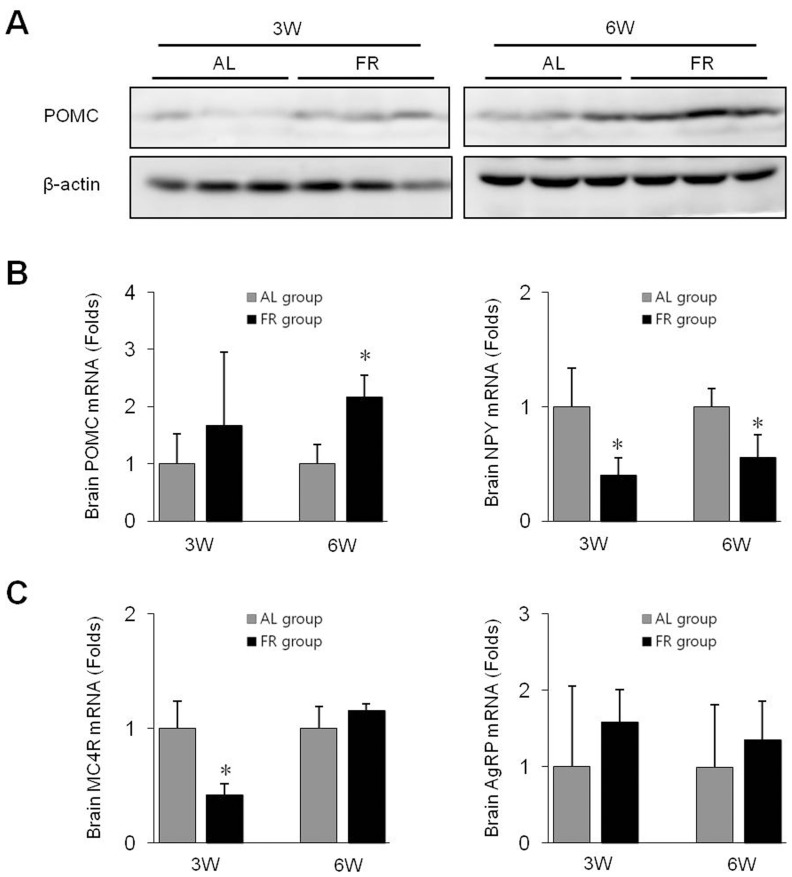
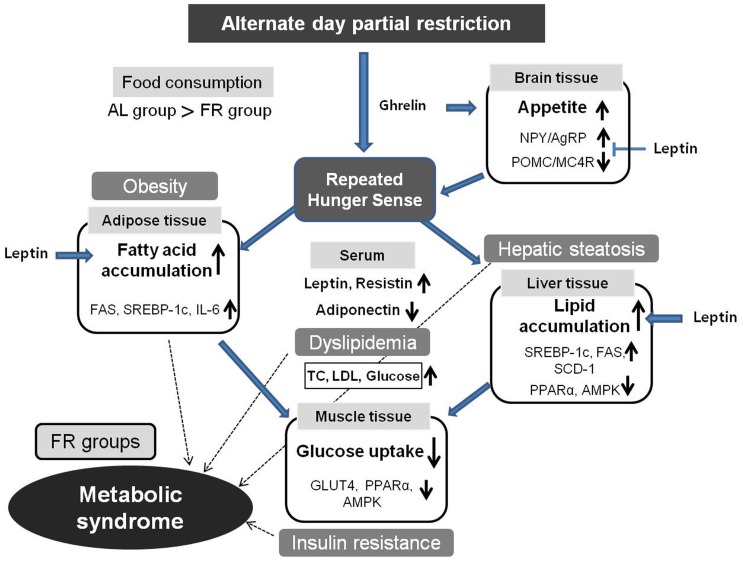
Obesity-related disorders, especially metabolic syndrome, contribute to 2.8 million deaths each year worldwide, with significantly increasing morbidity. Eating at regular times and proper food quantity are crucial for maintaining a healthy status. However, many people in developed countries do not follow a regular eating schedule due to a busy lifestyle. Herein, we show that a repeated sense of hunger leads to a high risk of developing visceral obesity and metabolic syndrome in a mouse model (both 3-week and 6-week-old age, 10 mice in each group). The ad libitum (AL) group (normal eating pattern) and the food restriction (FR) group (alternate-day partially food restriction by given only 1/3 of average amount) were compared after 8-week experimental period. The total food consumption in the FR group was lower than in the AL group, however, the FR group showed a metabolic syndrome-like condition with significant fat accumulation in adipose tissues. Consequently, the repeated sense of hunger induced the typical characteristics of metabolic syndrome in an animal model; a distinct visceral obesity, hyperlipidemia, hyperglycemia and hepatic steatosis. Furthermore, we found that specifically leptin, a major metabolic hormone, played a major role in the development of these pathological disorders. Our study indicated the importance of regular eating habits besides controlling calorie intake.
Conflict of interest statement
Figures
Similar articles
-
Angiotensin receptor-binding protein ATRAP/Agtrap inhibits metabolic dysfunction with visceral obesity.J Am Heart Assoc. 2013 Jul 31;2(4):e000312. doi: 10.1161/JAHA.113.000312. J Am Heart Assoc. 2013. PMID: 23902639 Free PMC article.
-
[Different adipose tissue depots and metabolic syndrome in human].Sheng Li Xue Bao. 2017 Jun 25;69(3):357-365. Sheng Li Xue Bao. 2017. PMID: 28638930 Review. Chinese.
-
Expression of MYD88 in Adipose Tissue of Obese People: Is There Some Role in the Development of Metabolic Syndrome?Metab Syndr Relat Disord. 2017 Mar;15(2):80-85. doi: 10.1089/met.2016.0104. Epub 2017 Jan 11. Metab Syndr Relat Disord. 2017. PMID: 28075222 Free PMC article.
-
Metabolic syndrome in mice induced by expressing a transcriptional activator in adipose tissue.Transgenic Res. 2012 Jun;21(3):633-44. doi: 10.1007/s11248-011-9562-2. Epub 2011 Oct 26. Transgenic Res. 2012. PMID: 22038448
-
The Role of Secretory Activity Molecules of Visceral Adipocytes in Abdominal Obesity in the Development of Cardiovascular Disease: A Review.Biomolecules. 2020 Feb 28;10(3):374. doi: 10.3390/biom10030374. Biomolecules. 2020. PMID: 32121175 Free PMC article. Review.
Cited by
-
Infrequent Feeding of Restricted Amounts of Food Induces Stress and Adipose Tissue Inflammation, Contributing to Impaired Glucose Metabolism.Int J Med Sci. 2018 Nov 5;15(14):1667-1675. doi: 10.7150/ijms.28503. eCollection 2018. Int J Med Sci. 2018. PMID: 30588190 Free PMC article.
-
Ghrelin, a novel therapy, corrects cytokine and NF-κB-AKT-MAPK network and mitigates intestinal injury induced by combined radiation and skin-wound trauma.Cell Biosci. 2020 May 12;10:63. doi: 10.1186/s13578-020-00425-z. eCollection 2020. Cell Biosci. 2020. PMID: 32426105 Free PMC article.
References
-
- WHO (2011) Obesity and Overweight: Factsheet No 311. World Health Organization.
-
- Devlin MJ, Yanovski SZ, Wilson GT (2000) Obesity: what mental health professionals need to know. Am J Psychiatry 157: 854–866. - PubMed
Publication types
MeSH terms
Substances
LinkOut - more resources
Full Text Sources
Other Literature Sources
Medical
