. 2014 Jul;13(7):919-32.
doi: 10.1128/EC.00260-13. Epub 2014 May 30.

TbKAP6, a mitochondrial HMG box-containing protein in Trypanosoma brucei, is the first trypanosomatid kinetoplast-associated protein essential for kinetoplast DNA replication and maintenance

Affiliations

TbKAP6, a mitochondrial HMG box-containing protein in Trypanosoma brucei, is the first trypanosomatid kinetoplast-associated protein essential for kinetoplast DNA replication and maintenance

Jianyang Wang et al. Eukaryot Cell. 2014 Jul.

Abstract

Kinetoplast DNA (kDNA), the mitochondrial genome of trypanosomatids, is a giant planar network of catenated minicircles and maxicircles. In vivo kDNA is organized as a highly condensed nucleoprotein disk. So far, in Trypanosoma brucei, proteins involved in the maintenance of the kDNA condensed structure remain poorly characterized. In Crithidia fasciculata, some small basic histone H1-like kinetoplast-associated proteins (CfKAP) have been shown to condense isolated kDNA networks in vitro. High-mobility group (HMG) box-containing proteins, such as mitochondrial transcription factor A (TFAM) in mammalian cells and Abf2 in the budding yeast, have been shown essential for the packaging of mitochondrial DNA (mtDNA) into mitochondrial nucleoids, remodeling of mitochondrial nucleoids, gene expression, and maintenance of mtDNA. Here, we report that TbKAP6, a mitochondrial HMG box-containing protein, is essential for parasite cell viability and involved in kDNA replication and maintenance. The RNA interference (RNAi) depletion of TbKAP6 stopped cell growth. Replication of both minicircles and maxicircles was inhibited. RNAi or overexpression of TbKAP6 resulted in the disorganization, shrinkage, and loss of kDNA. Minicircle release, the first step in kDNA replication, was inhibited immediately after induction of RNAi, but it quickly increased 3-fold upon overexpression of TbKAP6. Since the release of covalently closed minicircles is mediated by a type II topoisomerase (topo II), we examined the potential interactions between TbKAP6 and topo II. Recombinant TbKAP6 (rTbKAP6) promotes the topo II-mediated decatenation of kDNA. rTbKAP6 can condense isolated kDNA networks in vitro. These results indicate that TbKAP6 is involved in the replication and maintenance of kDNA.


Figures

FIG 1
FIG 1
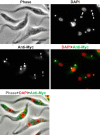
TbKAP6-Myc localized on kDNA disk. Stars show kinetoplasts viewed from the top and arrowheads show kinetoplasts viewed from the edge. N, nucleus; k, kinetoplast DNA. In merged panels, DAPI is in red and anti-Myc is in green. Bar, 5 μm.
FIG 2
FIG 2
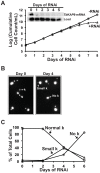
TbKAP6 RNAi arrested cell growth and caused kDNA loss in some cells. (A) Effects of TbKAP6 RNAi on cell growth. The cumulative cell count on the y axis is the measured value times the dilution factor. Inset, Northern blot of TbKAP6 mRNA (630 bp) isolated from uninduced cells or cells induced for RNAi for 5 days. Tubulin mRNA is probed as the loading control. (B) Examples of kDNA morphology changes following TbKAP6 RNAi, shown by DAPI staining of uninduced cells (day 0) and cells induced for RNAi for 4 days (day 4). N, nucleus; k, kinetoplast DNA. (C) Kinetics of kDNA loss during a 6-day course of TbKAP6 RNAi. At each time point, at least 500 randomly chosen DAPI-stained cells were evaluated.
FIG 3
FIG 3
TbKAP6 RNAi caused kDNA disorganization and shrinkage. (A) DAPI-stained kDNAs isolated from uninduced cells (day 0) and cells induced for RNAi for 2, 4, and 6 days. Star, kDNA of unit size; arrowhead, kDNA of intermediate size; arrow, kDNA of double size. Bar, 5 μm. (B) Kinetics of average surface area of DAPI-stained kDNA isolated from cells without or with RNAi. Relative value is the ratio of average surface area at each time point to that of day 0. At each time point, at least 250 well-spread kDNA networks were evaluated. (C) TdT labeling of kDNA isolated from uninduced cells (day 0) and cells induced for RNAi for 2, 4, and 6 days (days 2, 4, and 6). DAPI is in red and TdT labeling is in green. Bar, 5 μm. (D) Electron micrographs of kDNA isolated from uninduced cells (day 0) and cells induced for RNAi for 4 days (day 4). Bar, 500 nm. (E) Electron micrographs of thin sections of resin-embedded cells without (day 0) or with RNAi (day 4). Arrow, kinetoplast DNA; arrowhead, additional DNA fibers close to the kinetoplast; FP, flagellar pocket; FL, flagellum; BB, basal body. Bar, 500 nm.
FIG 4
FIG 4
TbKAP6 RNAi inhibited kDNA replication. (A) Effects on kDNA abundance. Total DNA (106 cell equivalents/lane) isolated from cells without or with RNAi was digested with HindIII/XbaI, Southern blotted, and probed for minicircles (1.0-kb linearized minicircles), maxicircles (a 1.4-kb fragment), and nucleus-encoded trypanosome hexose transporter (THT) genes as the loading control (Load). (B) Changes of total minicircle and maxicircle abundance in a representative clonal cell line during the course of TbKAP6 RNAi. DNA abundance was measured by phosphorimaging of the Southern blot shown in panel A. Relative value is the ratio of total minicircle or maxicircle abundance to that of the loading control (THT). (C) Effects on free minicircle intermediates. Total DNA (106 cell equivalents/lane) isolated from cells without or with RNAi was fractionated by agarose gel electrophoresis, Southern blotted, and probed for minicircles and THT for loading control. N/G, nicked/gapped minicircle; CC, covalently closed minicircle. (D) The abundances of N/G and CC minicircles decreased upon the depletion of TbKAP6. DNA abundances from Southern blots shown in panel C, which is a representative example of three independent clonal cell lines, and the other two blots (data not shown) were averaged to obtain the error bars and plotted. (E) Effects on maxicircle replication intermediates. Total DNA (106 cell equivalents/lane) isolated from cells without or with RNAi was decatenated by topo IV, fractionated by agarose gel electrophoresis, Southern blotted, and probed for maxicircles and THT for loading control. N/G, nicked/gapped maxicircle; CC, covalently closed maxicircle; L., linear maxicircle.
FIG 5
FIG 5
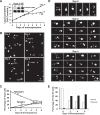
Overexpression of TbKAP6 arrested cell growth and caused kDNA loss and segregation defects in some cells. (A) Effects on cell growth. The cumulative cell count on the y axis is the measured value times the dilution factor. Inset, Northern blot of TbKAP6 mRNA isolated from uninduced cells or cells induced for overexpression for 1 day and 2 days. Tubulin mRNA is probed as the loading control. (B) Effects on kDNA morphology changes following overexpression, shown by DAPI staining of uninduced cells (day 0) and cells induced for overexpression for 2, 4, and 6 days. N, nucleus; k, kinetoplast DNA. Star, kinetoplasts that underwent asymmetric segregation. Bar, 5 μm. (C) Kinetics of kDNA loss during a 6-day course of overexpression. At each time point, 400 to 600 randomly chosen DAPI-stained cells were evaluated. (D) Effects on kDNA segregation, shown by DAPI staining of uninduced cells (day 0) and cells induced for overexpression for 2 and 4 days. Arrows, the larger daughter kinetoplast from asymmetric segregation; arrowheads, the smaller daughter kinetoplast from asymmetric segregation. Bar, 5 μm. (E) Bar graphs showing increasing kDNA segregation defects during a 6-day course of overexpression. At different time points, 40 to 100 2K cells were analyzed. White bar, cells with normal symmetric segregation of sister kDNAs; black bar, cells with kDNA segregation defects.
FIG 6
FIG 6
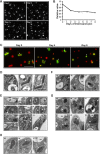
Overexpression of TbKAP6 caused kDNA disorganization and shrinkage. (A) Examples of DAPI-stained kDNAs isolated from uninduced cells (day 0) and cells induced for overexpression for 2, 4, and 6 days. Star, kDNA of unit size; arrowhead in the panel for day 0, kDNA of intermediate size; arrow, kDNA of double size. Arrowheads in panels for days 2, 4, and 6, kDNA with lower fluorescent density. (B) Kinetics of average surface area of DAPI-stained kDNA isolated from cells without or with overexpression. Relative value is the ratio of average surface area at each time point to that of day 0. At each time point, 400 to 600 well-spread kDNA networks were quantified. (C) TdT labeling of kDNA isolated from uninduced cells (day 0) and cells induced for overexpression for 2, 4, and 6 days. DAPI is in red and TdT labeling is in green. (D to H) Electron micrographs of thin sections of resin-embedded cells without (day 0; D) or with overexpression (day 4; E to H). FP, flagellar pocket; FL, flagellum; BB, basal body; white arrows, kDNA. For all electron micrographs (D to H), bar = 500 nm.
FIG 7
FIG 7
Effects of TbKAP6 overexpression on free minicircle intermediates. (A) Effects on free minicircle intermediates. Total DNA (106 cell equivalents/lane) isolated from cells without or with overexpression was fractionated by agarose gel electrophoresis, Southern blotted, and probed for minicircles and THT for loading control. N/G, nicked/gapped minicircle; CC, covalently closed minicircle. (B) Changes of the abundances of N/G and CC minicircles during the course of TbKAP6 overexpression. DNA abundances were quantified by phosphorimaging of the Southern blot shown in panel A. Relative value is the ratio of N/G or CC minicircle abundance to that of the loading control (THT).
FIG 8
FIG 8
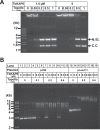
Recombinant TbKAP6 (rTbKAP6) promotes decatenation of C. fasciculata kinetoplast DNA by human topoisomerase II (topo II) and relaxation of supercoiled plasmid DNAs. (A) The decatenation of CfkDNA by topo II is stimulated by rTbKAP6. CfkDNA (200 ng) was incubated with increasing amounts of topo II (0.05 to 1 unit) in the presence (lanes 1 to 5) and absence (lanes 6 to 10) of rTbKAP6. The reaction mixtures were then examined by agarose-EtBr gel electrophoresis. N/G, nicked/gapped minicircle; CC, covalently closed minicircle. M, 1 kb plus DNA ladder (Invitrogen). (B) The relaxation of supercoiled plasmid DNAs by topo II is stimulated by rTbKAP6. Supercoiled plasmids (350 ng), including a Trypanosoma equiperdum minicircle-containing plasmid pJN6 (lanes 1 to 12) and a nonrelated plasmid pLew111 (lanes 13 to 19), were incubated with 0.1 to 0.4 unit of topo II in the presence of 0.3 to 0.6 μM TbKAP6 or absence of rTbKAP6 (lanes 4, 7, 10) at 37°C for 45 min. As controls, the plasmids incubated only with rTbKAP6 in the same topo II relaxation reaction buffer (lanes 2, 3, 14) as described above or without incubation (lanes 1 and 13) were loaded for comparison.

Similar articles

Cited by

References

    1. Barrett MP, Vincent IM, Burchmore RJ, Kazibwe AJ, Matovu E. 2011. Drug resistance in human African trypanosomiasis. Future Microbiol. 6:1037–1047. 10.2217/fmb.11.88 - DOI - PubMed
    1. Brun R, Don R, Jacobs RT, Wang MZ, Barrett MP. 2011. Development of novel drugs for human African trypanosomiasis. Future Microbiol. 6:677–691. 10.2217/fmb.11.44 - DOI - PubMed
    1. Jensen RE, Englund PT. 2012. Network news: the replication of kinetoplast DNA. Annu. Rev. Microbiol. 66:473–491. 10.1146/annurev-micro-092611-150057 - DOI - PubMed
    1. Roy Chowdhury A, Bakshi R, Wang J, Yildirir G, Liu B, Pappas-Brown V, Tolun G, Griffith JD, Shapiro TA, Jensen RE, Englund PT. 2010. The killing of African trypanosomes by ethidium bromide. PLoS Pathog. 6:e1001226. 10.1371/journal.ppat.1001226 - DOI - PMC - PubMed
    1. Shlomai J. 2004. The structure and replication of kinetoplast DNA. Curr. Mol. Med. 4:623–647. 10.2174/1566524043360096 - DOI - PubMed

Publication types

MeSH terms

LinkOut - more resources