. 2014 Jun;10(6):986-1003.
doi: 10.4161/auto.28390.

The role of GABARAPL1/GEC1 in autophagic flux and mitochondrial quality control in MDA-MB-436 breast cancer cells

Affiliations

The role of GABARAPL1/GEC1 in autophagic flux and mitochondrial quality control in MDA-MB-436 breast cancer cells

Michaël Boyer-Guittaut et al. Autophagy. 2014 Jun.

Erratum in

  • Correction.
    [No authors listed] [No authors listed] Autophagy. 2019 Oct;15(10):1857. doi: 10.1080/15548627.2019.1639958. Epub 2019 Jul 6. Autophagy. 2019. PMID: 31280645 Free PMC article. No abstract available.

Abstract

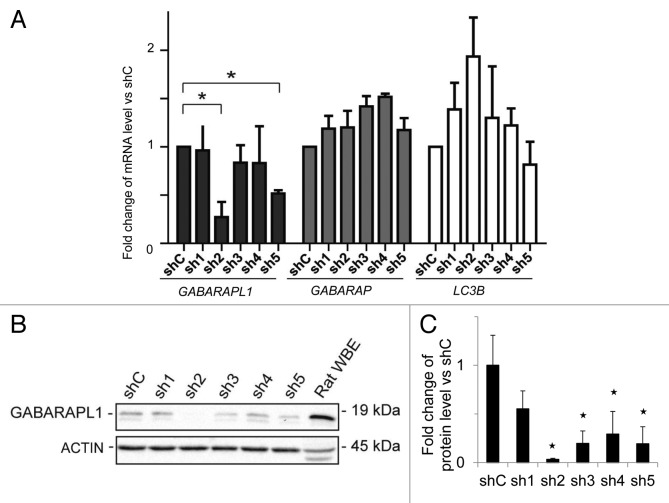
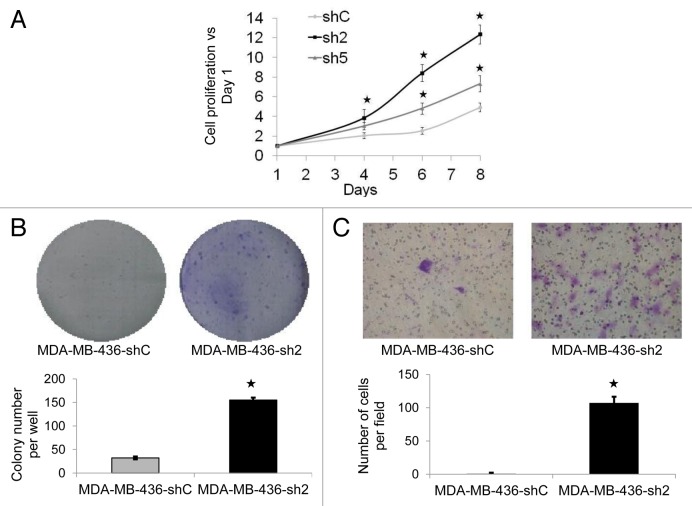
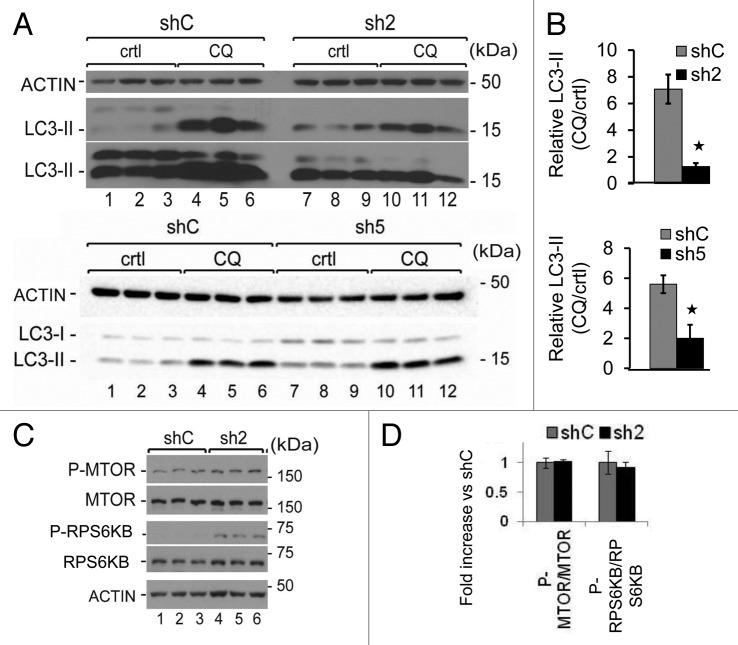
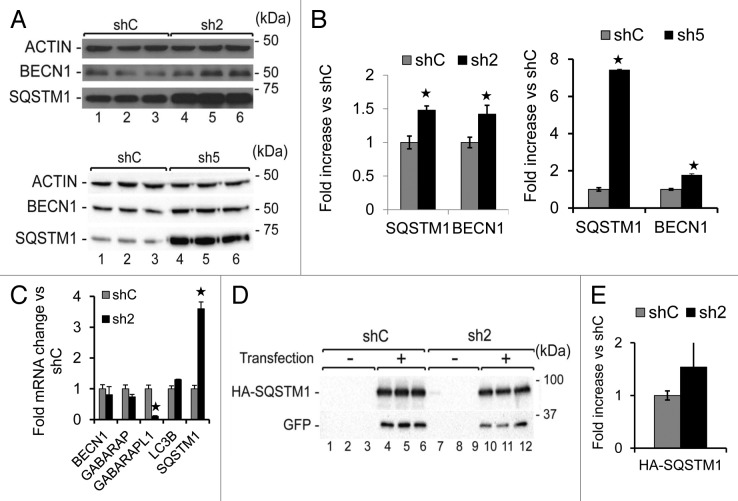
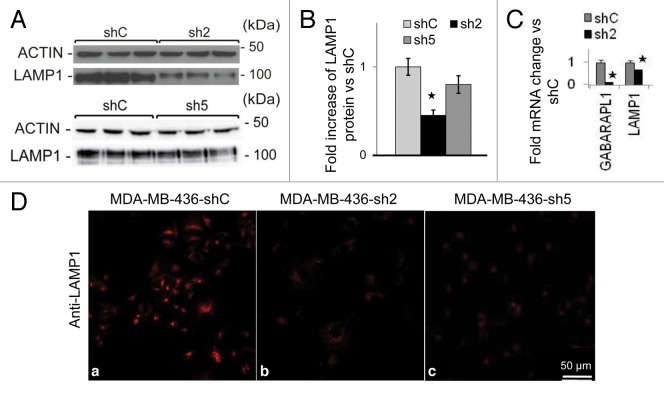
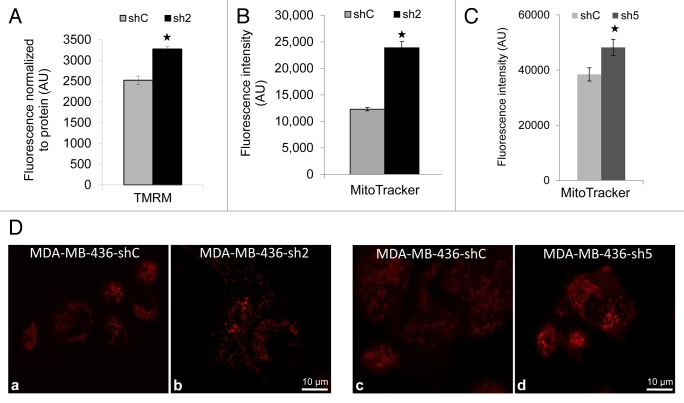
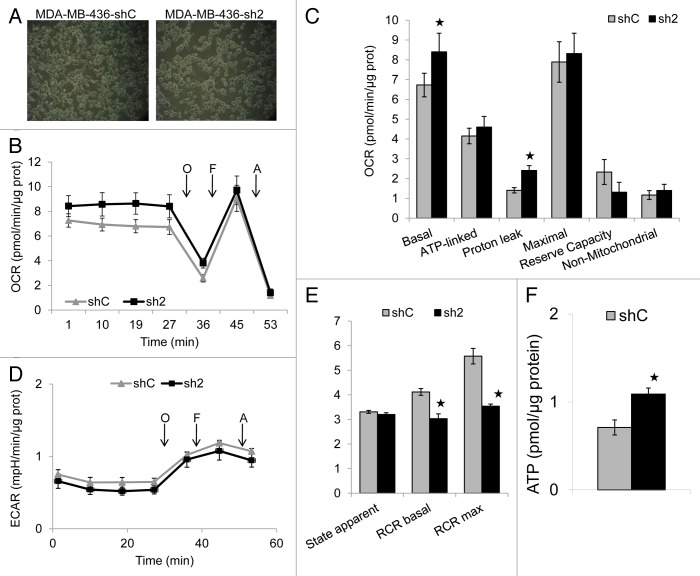
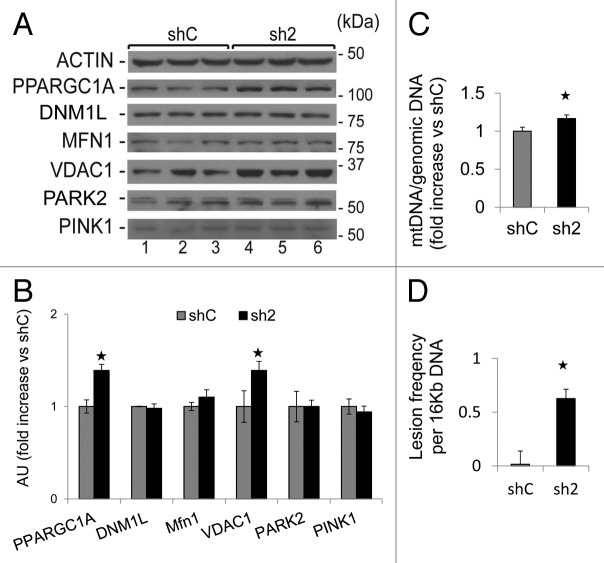
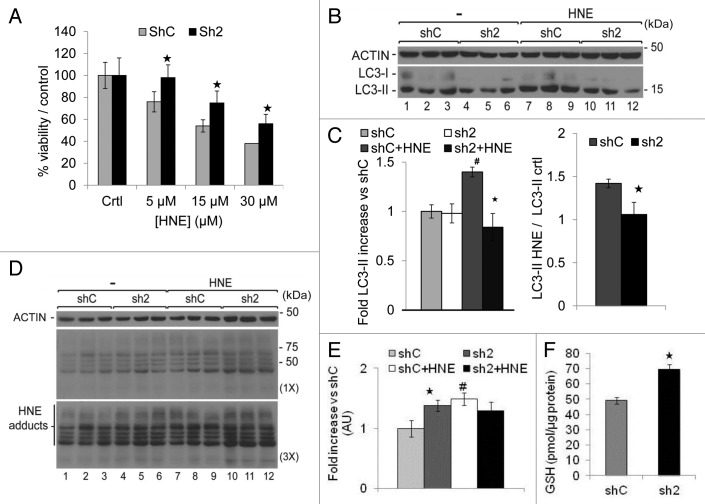
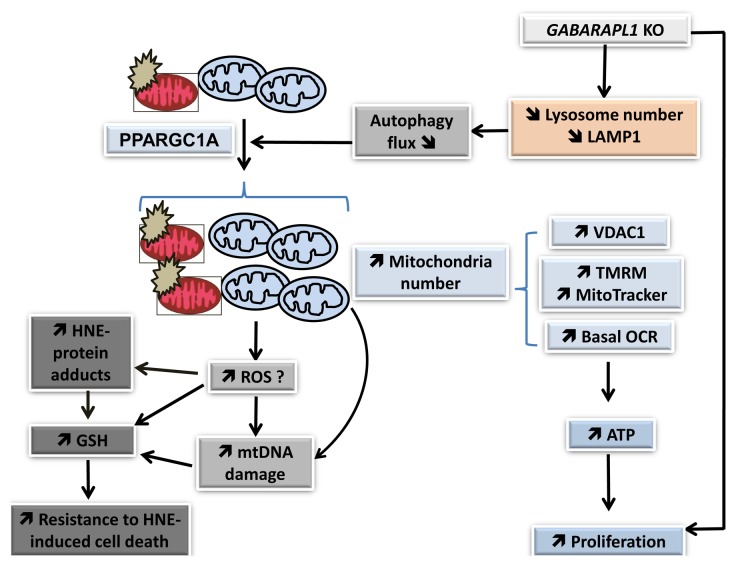
GABARAPL1/GEC1 is an early estrogen-induced gene which encodes a protein highly conserved from C. elegans to humans. Overexpressed GABARAPL1 interacts with GABAA or kappa opioid receptors, associates with autophagic vesicles, and inhibits breast cancer cell proliferation. However, the function of endogenous GABARAPL1 has not been extensively studied. We hypothesized that GABARAPL1 is required for maintaining normal autophagic flux, and plays an important role in regulating cellular bioenergetics and metabolism. To test this hypothesis, we knocked down GABARAPL1 expression in the breast cancer MDA-MB-436 cell line by shRNA. Decreased expression of GABARAPL1 activated procancer responses of the MDA-MB-436 cells including increased proliferation, colony formation, and invasion. In addition, cells with decreased expression of GABARAPL1 exhibited attenuated autophagic flux and a decreased number of lysosomes. Moreover, decreased GABARAPL1 expression led to cellular bioenergetic changes including increased basal oxygen consumption rate, increased intracellular ATP, increased total glutathione, and an accumulation of damaged mitochondria. Taken together, our results demonstrate that GABARAPL1 plays an important role in cell proliferation, invasion, and autophagic flux, as well as in mitochondrial homeostasis and cellular metabolic programs.

Keywords: GABARAP; GABARAPL1; GEC1; LAMP1; LC3; MDA-MB-436; autophagy; breast cancer; lysosome; mitochondria; mitophagy.


Figures

None
Figure 1.GABARAPL1 mRNA and protein expression are significantly decreased in the MDA-MB-436-sh2 clone. (A) GABARAPL1, GABARAP, and LC3B mRNA expression was analyzed by qRT-PCR in the different MDA-MB-436 stable cell lines. The different stable cell lines, expressing 1 of the 5 shRNAs directed against the GABARAPL1 gene (sh1 to sh5), were compared with the stable MDA-MB-436 cell line expressing a control shRNA (shC). *P < 0.05, vs shC (n = 3). (B) GABARAPL1 expression levels in the MDA-MB-436 stable cell lines were determined by western blotting. Total proteins (40 µg) were separated on a 15% SDS-PAGE gel and immunoblotted using anti-GABARAPL1 and anti-ACTIN antibodies and the ECL Plus reagent. A representative experiment of 3 performed is shown. Rat whole brain extract (WBE) was used as a positive control of GABARAPL1 expression. (C) Quantification of the signals observed on the western blot in (B). *P < 0.05, vs shC (n = 3).
None
Figure 2. GABARAPL1 knockdown promotes cell growth, colony formation, and invasion. (A) MDA-MB-436-shC, sh2 and sh5 cell growth was determined using a MTT assay over an 8-d period. All data were normalized to the number of cells at d 1 for each cell line. *P < 0.05, vs shC (n = 24). (B) MDA-MB-436-shC and sh2 cells (3,000 in 6-well plates) were grown for a period of 12 d then fixed and stained with crystal violet. The number of colonies was then determined using the Vision-Capt software (VilberLourmat). A representative experiment of 3 performed is shown. *P < 0.05, vs shC (n = 3). (C) MDA-MB-436-shC and sh2 cells were grown in modified Boyden chambers coated with ECM gel. After a 24 h incubation at 37 °C, cells in the upper chamber were swabbed while cells in the lower chamber were fixed, stained with crystal violet and counted using a light microscope at a high magnification (×400). A representative experiment of 3 performed is shown. *P < 0.05, vs shC (n = 3).
None
Figure 3. GABARAPL1 knockdown inhibits autophagic flux without changing MTOR signaling. (A) MDA-MB436-shC, sh2, and sh5 cells were cultured for 5 h in the presence (lanes 4 to 6 and 10 to 12) or absence (lanes 1 to 3 and 7 to 9) of the lysosome inhibitor chloroquine (40 μM). Total proteins (25 µg) were separated on 12% SDS-PAGE gels followed by immunoblotting with anti-LC3 and anti-ACTIN antibodies and the ECL Plus reagent. A representative experiment of 3 performed is shown. (B) The autophagy flux was determined as the levels of LC3-II in the presence of chloroquine divided by the levels of LC3-II in absence of chloroquine. *P < 0.05, vs shC (n = 3). (C) MDA-MB436-shC and sh2 cells were cultured for 24 h at 37 °C and 5% CO2 then total proteins (25 µg) were separated on 12% SDS-PAGE gels followed by immunoblotting with anti-phospho-MTOR, anti-MTOR, anti-phospho-RPS6KB, anti-RPS6KB, and anti-ACTIN antibodies and the ECL Plus reagent. A representative experiment of 3 performed is shown. *P < 0.05, vs shC (n = 3). (D) Quantification of the signals observed on the western blot in (C) (n = 3).
None
Figure 4. GABARAPL1 knockdown leads to increased SQSTM1 and BECN1 proteins.(A) MDA-MB436-shC, sh2, and sh5 cells were cultured for 24 h at 37 °C and 5% CO2 then total proteins (25 µg) were separated on 12% SDS-PAGE gels followed by immunoblotting with anti-BECN1, anti-SQSTM1 and anti-ACTIN antibodies and the ECL Plus reagent. A representative experiment of 3 performed is shown. (B) Quantification of the signals observed on the western blot in (A). *P < 0.05, vs shC (n = 3). (C) GABARAPL1, GABARAP, LC3B, BECN1, and SQSTM1 mRNA expression was analyzed by qRT-PCR in the MDA-MB436-shC, and sh2 cells. *P < 0.05, vs shC (n = 3). (D) MDA-MB436-shC and sh2 cells were cotransfected with the vectors expressing HA-SQSTM1 and pEGFP-N1 (ratio 10:1). Forty-eight hours after transfection, total proteins (25 µg) were separated on 12% SDS-PAGE gels, followed by immunoblotting with anti-HA, anti-GFP, and anti-ACTIN antibodies and the ECL Plus reagent. A representative experiment of 3 performed is shown. (E) Quantification of the signals observed on the western blot in (D). *P < 0.05, vs shC (n = 3).
None
Figure 5. GABARAPL1 knockdown leads to decreased LAMP1 protein levels and immunocytochemistry staining.(A) MDA-MB436-shC, sh2, and sh5 cells were cultured for 24 h at 37 °C and 5% CO2 then total proteins (25 µg) were separated on 12% SDS-PAGE gels followed by immunoblotting with anti-LAMP1 antibodies and the ECL Plus reagent. A representative experiment of 3 performed is shown. (B) Quantification of the signals observed on the western blot in (A). *P < 0.05, vs shC (n = 3). (C) GABARAPL1 and LAMP1 mRNA expression was analyzed by qRT-PCR in the MDA-MB436-shC and sh2 cells. *P < 0.05, vs shC. (D) MDA-MB436-shC, sh2 and sh5 cells were cultured for 24 h at 37 °C and 5% CO2, fixed, permeabilized, blocked with 5% BSA, incubated with a monoclonal anti-mouse LAMP1 overnight at 4 °C and then with an Alexa Fluor 555 goat anti-mouse for 1 h. The cells were then analyzed using a confocal microscope. Each picture is representative of a typical cell staining observed in 10 fields chosen at random.
None
Figure 6. GABARAPL1 knockdown increases TMRM and MitoTracker Red staining. (A) TMRM staining (AU, arbitrary units) normalized to total protein. MDA-MB436-shC and sh2 cells (40,000) were cultured in 96-well plates for 24 h at 37 °C and 5% CO2. Cells were then incubated with 100 nM TMRM for 45 min before being washed with PBS. TMRM fluorescence was measured at 590 nm using a Victor3V Perkinelmer Wallace 1420 Multilabel Counter. FCCP as a control decreased mitochondrial membrane potential to ~750 in both shC and sh2 cells. *P < 0.05, vs shC (n = 3). (B) MitoTracker Red fluorescence values (AU) for the 2 cell lines shC and sh2. Cells (600,000) were cultured in 6-well plates for 24 h at 37 °C and 5% CO2, stained with 50 nM MitoTracker Red for 45 min at 37 °C, trypsinized, washed with PBS and resuspended in 500 µl PBS. Intracellular fluorescence was then assessed using the LSR-II Becton Dickinson flow cytometer. *P < 0.05, vs shC (n = 3). (C) MDA-MB436-shC and sh5 cells (100,000) were cultured in Labtek 4-well plates for 24 h at 37 °C and 5% CO2, stained with 50 nM MitoTracker Red for 45 min at 37 °C and washed with PBS. Mitochondria were imaged using the Zeiss LSM 710 confocal microscope and the Zen 2008 software. MitoTracker intensity was quantified by Image J for 25 cells for each cell line in 5 different fields of view chosen at random. *P < 0.05, vs shC. (D) MDA-MB436-shC and sh2 cells (100,000) were cultured in Labtek 4-well plates for 24 h at 37 °C and 5% CO2, stained with 50 nM MitoTracker Red for 45 min at 37 °C and washed with PBS. Similarly, MDA-MB436-shC and sh5 cells (100,000) were cultured, stained with MitoTracker Red, and imaged. The pictures were taken with the Zeiss LSM 710 confocal microscope.
None
Figure 7. GABARAPL1 knockdown increases basal and proton-leak oxygen consumption rate (OCR), increases intracellular ATP levels, and decreases basal and maximal respiratory control ratio (RCR). MDA-MB436-shC and sh2 cells (60,000) were cultured for 24 h in 24-well XF24 Seahorse Biosciences V7 microplates and then bioenergetic function was assessed using the Seahorse XF24 analyzer. Both OCR and ECAR were measured. The ATP synthase inhibitor oligomycin (O; 1 μM), uncoupler FCCP (F; 0.75 μM), and complex III inhibitor antimycin A (A; 10 μM) were injected at the indicated times to determine different parameters of mitochondrial function. (A) Pictures showing similar confluency of the shC and sh2 cells before the start of the Seahorse analysis. (B) OCR values shown as pmol O2/min/μg protein. (C) Histogram showing the comparison of basal, ATP-linked, proton leak-linked, maximal, and non-mitochondrial OCR of shC and sh2 cells. Nonmitochondrial OCR was determined as the OCR after antimycin A treatment. Basal OCR was determined as OCR before oligomycin minus OCR after antimycin A. ATP-linked OCR was determined as OCR before oligomycin minus OCR after oligomycin. Proton leak was determined as basal OCR minus ATP-linked OCR. Maximal OCR was determined as the OCR after FCCP minus nonmitochondrial OCR. Reserve capacity was defined as the difference between maximal OCR after FCCP minus basal OCR. *P < 0.05, vs shC (n = 4). (D) Extracellular acidification rate (ECAR) values were plotted as mpH/min/μg protein for shC and sh2 cells (n = 4). (E) Histogram showing the comparison of state apparent, RCR basal and RCR maximal of shC and sh2 cells. State apparent was determined as the value corresponding to the following formula: 4-[(Basal-Oligo)/(Basal-FCCP)]. RCR basal was determined as the value corresponding to the following formula: (Basal-AntiA)/(Oligo-AntiA). RCR maximal was determined as the value corresponding to the following formula: (FCCP-AntiA)/(Oligo-AntiA). *P < 0.05, vs shC (n = 4). (F) Histogram showing intracellular ATP values (pmoles/µg protein) for shC and sh2 cells. MDA-MB436-shC and sh2 cells (40,000) were cultured in 96-well plates for 24 h at 37 °C and 5% CO2. The intracellular ATP concentration was then determined using the ATPlite kit from PerkinElmer according to the manufacturer’s instructions. Luminescence was measured using a Victor2V Perkinelmer Wallace 1420 Multilabel Counter. *P < 0.05, vs shC (n = 3).
None
Figure 8. GABARAPL1 knockdown increases mitochondria number, and mtDNA damage. (A) MDA-MB436-shC and sh2 cells were cultured for 24 h at 37 °C and 5% CO2. Cells were then lysed in the presence of protease and phosphatase inhibitors and total proteins (25 µg) were separated on 12% SDS-PAGE gels followed by immunoblotting with anti-PPARGC1A, anti-DNM1L, anti-MFN1, anti-VDAC1, anti-PARK2, anti-PINK1, and anti-ACTIN antibodies and the ECL Plus reagent. A representative experiment of 3 performed is shown. (B) Quantification of the signals on the western blot in (A). *P < 0.05, vs shC (n = 3). (C) MDA-MB436-shC and sh2 cells (600,000) were cultured in 6-well plates for 24 h at 37 °C and 5% CO2. Cells were washed with PBS and kept frozen at −80 °C until purification of total DNA. Specific genomic and mitochondrial DNA sequences were amplified by quantitative real-time PCR. The data are presented as the ratio of mitochondrial vs. genomic DNA and normalized to the control cell line, shC. *P < 0.05, vs shC (n = 3). (D)MDA-MB436-shC and sh2 cells (600,000) were cultured in 6-well plates for 24 h at 37 °C and 5% CO2. Cells were washed with PBS and kept frozen at −80 °C until purification of total DNA. Specific long and short mitochondrial DNA sequences were amplified by PCR. The data were calculated from the levels of long mitochondrial PCR product vs. levels of short mitochondrial PCR product as described in Materials and Methods, and normalized to shC. *P < 0.05, vs shC (n = 3).
None
Figure 9. GABARAPL1 knockdown enhances cell survival in response to HNE, inhibits autophagic flux in response to HNE, and increases intracellular HNE-protein adducts and glutathione (GSH) concentration. (A) MDA-MB436-shC and sh2 cells were grown for 16 h in the presence of HNE (0, 5, 15 or 30 µM). Cells were then trypsinized and counted in the presence of trypan blue. The values were normalized to the number of cells determined in the control samples for each cell line. *P < 0.05, vs shC (n = 3). (B) MDA-MB436-shC and sh2 cells were cultured for 16 h in the presence of HNE (30 µM). Cells were then lysed and total proteins (25 µg) were separated on 12% SDS-PAGE gels followed by immunoblotting with anti-LC3 and anti-ACTIN antibodies and the ECL Plus reagent. A representative experiment of 3 performed is shown. (C) Quantification of the LC3-II signals observed in the western blots shown in (B). HNE-induced changes of LC3-II levels were determined as the levels of LC3-II in response to HNE divided by the levels of LC3-II without HNE. *P < 0.05, vs shC (n = 3), #P < 0.05, vs untreated cells (n = 3). (D) MDA-MB436-shC and sh2 cells were cultured for 16 h in the presence of HNE (30 µM). Cells were then lysed in HNE lysis buffer containing 10 mM N-ethylmaleimide and total proteins (25 µg) were separated on 12% SDS-PAGE gels followed by immunoblotting with anti-4-HNE and anti-ACTIN antibodies and the ECL Plus reagent. (E) Quantification of the signals observed in the western blot in (D). *P < 0.05, vs shC (n = 3), #P < 0.05, vs untreated cells (n = 3). (F) Total cellular GSH was determined using the GSH recycling assay, as described in Materials and Methods, using a Beckman Coulter DU-800 spectrophotometer, after shC and sh2 cells (600,000) were cultured in 6-well plates for 24 h at 37 °C. *P < 0.05, vs shC (n = 3).
None
Figure 10. GABARAPL1 function in breast cancer cells. Our studies indicate that GABARAPL1 plays an important role in autophagic flux, mitochondrial homeostasis, metabolic programming, and control of cell proliferation in breast cancer MDA-MB-436 cells. GABARAPL1 knockdown induces a disruption of the autophagosome-lysosome pathway leading to a decrease of lysosome number and accumulation of damaged mitochondria, increased mitochondrial biogenesis and number, and increased mitochondrial respiration, mitochondrial membrane potential, mitochondrial proteins, and mtDNA damage. This is further evidenced by an increase of HNE-protein adducts, increased antioxidant response, and increased ATP levels. The increase of mitochondrial number, cellular glutathione, and cellular ATP may contribute to resistance to cell death and increased proliferation.

Similar articles

Cited by

References

    1. Pellerin I, Vuillermoz C, Jouvenot M, Ordener C, Royez M, Adessi GL. Identification and characterization of an early estrogen-regulated RNA in cultured guinea-pig endometrial cells. Mol Cell Endocrinol. 1993;90:R17–21. doi: 10.1016/0303-7207(93)90161-C. - DOI - PubMed
    1. Chakrama FZ, Seguin-Py S, Le Grand JN, Fraichard A, Delage-Mourroux R, Despouy G, Perez V, Jouvenot M, Boyer-Guittaut M. GABARAPL1 (GEC1) associates with autophagic vesicles. Autophagy. 2010;6:495–505. doi: 10.4161/auto.6.4.11819. - DOI - PubMed
    1. Wang H, Bedford FK, Brandon NJ, Moss SJ, Olsen RW. GABA(A)-receptor-associated protein links GABA(A) receptors and the cytoskeleton. Nature. 1999;397:69–72. doi: 10.1038/16264. - DOI - PubMed
    1. Shpilka T, Weidberg H, Pietrokovski S, Elazar Z. Atg8: an autophagy-related ubiquitin-like protein family. Genome Biol. 2011;12:226. doi: 10.1186/gb-2011-12-7-226. - DOI - PMC - PubMed
    1. Mansuy V, Boireau W, Fraichard A, Schlick JL, Jouvenot M, Delage-Mourroux R. GEC1, a protein related to GABARAP, interacts with tubulin and GABA(A) receptor. Biochem Biophys Res Commun. 2004;325:639–48. doi: 10.1016/j.bbrc.2004.10.072. - DOI - PubMed

Publication types

MeSH terms