

Identification of two poorly prognosed ovarian carcinoma subtypes associated with CHEK2 germ-line mutation and non-CHEK2 somatic mutation gene signatures
- PMID: 24879340
- PMCID: PMC4111681
- DOI: 10.4161/cc.29271
Identification of two poorly prognosed ovarian carcinoma subtypes associated with CHEK2 germ-line mutation and non-CHEK2 somatic mutation gene signatures
Abstract
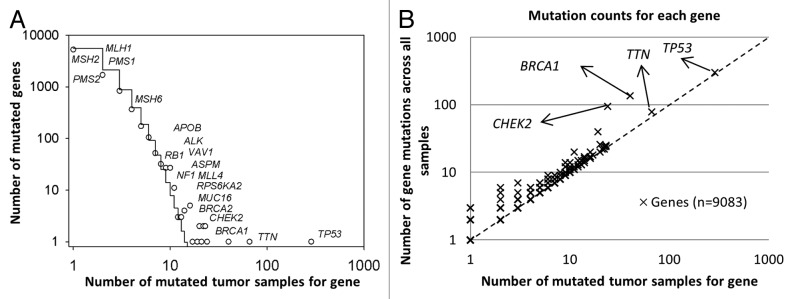
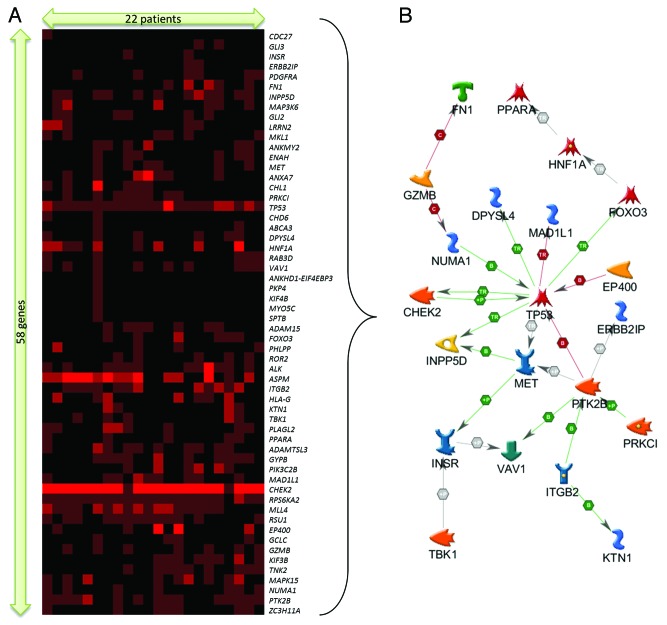
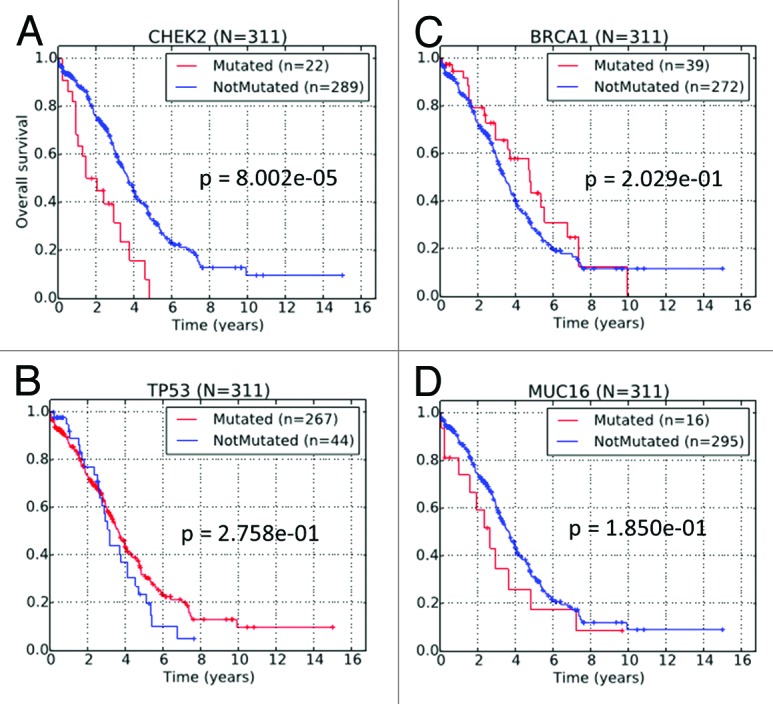
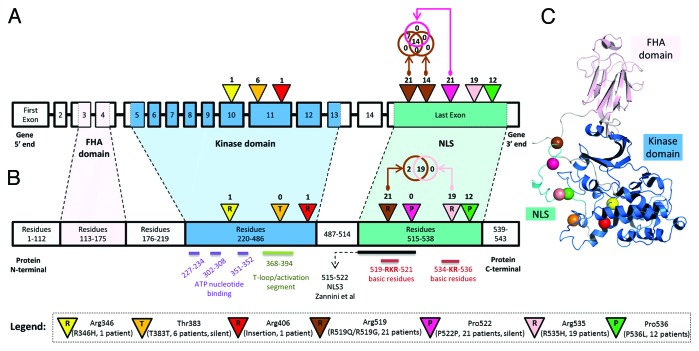
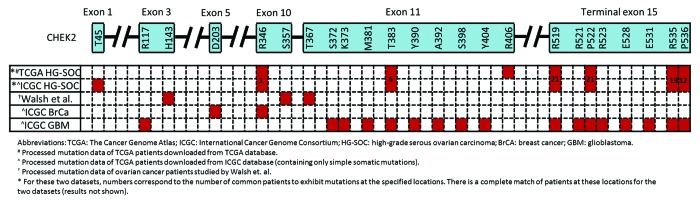
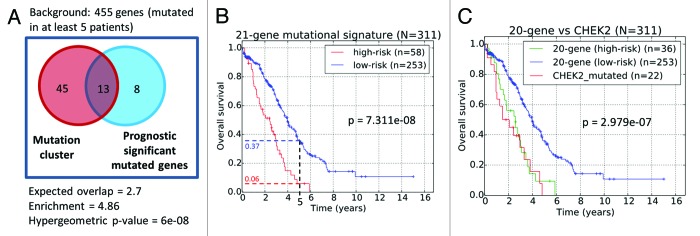
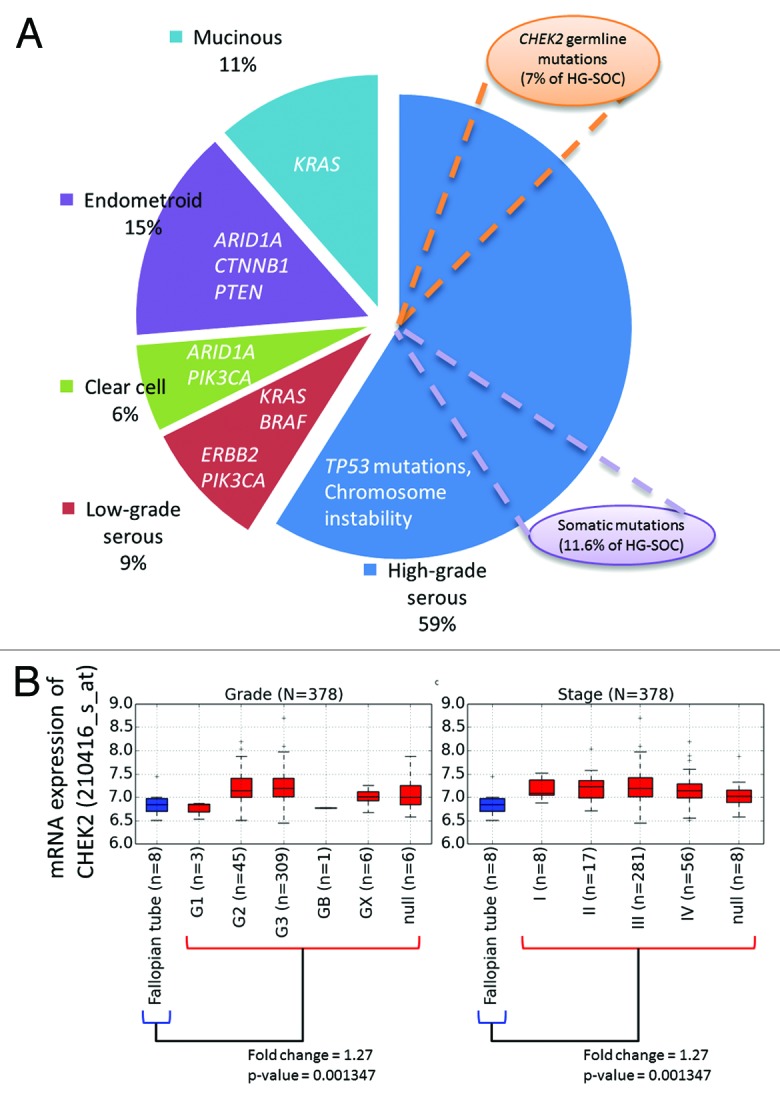
High-grade serous ovarian cancer (HG-SOC), a major histologic type of epithelial ovarian cancer (EOC), is a poorly-characterized, heterogeneous and lethal disease where somatic mutations of TP53 are common and inherited loss-of-function mutations in BRCA1/2 predispose to cancer in 9.5-13% of EOC patients. However, the overall burden of disease due to either inherited or sporadic mutations is not known. We performed bioinformatics analyses of mutational and clinical data of 334 HG-SOC tumor samples from The Cancer Genome Atlas to identify novel tumor-driving mutations, survival-significant patient subgroups and tumor subtypes potentially driven by either hereditary or sporadic factors. We identified a sub-cluster of high-frequency mutations in 22 patients and 58 genes associated with DNA damage repair, apoptosis and cell cycle. Mutations of CHEK2, observed with the highest intensity, were associated with poor therapy response and overall survival (OS) of these patients (P = 8.00e-05), possibly due to detrimental effect of mutations at the nuclear localization signal. A 21-gene mutational prognostic signature significantly stratifies patients into relatively low or high-risk subgroups with 5-y OS of 37% or 6%, respectively (P = 7.31e-08). Further analysis of these genes and high-risk subgroup revealed 2 distinct classes of tumors characterized by either germline mutations of genes such as CHEK2, RPS6KA2 and MLL4, or somatic mutations of other genes in the signature. Our results could provide improvement in prediction and clinical management of HG-SOC, facilitate our understanding of this complex disease, guide the design of targeted therapeutics and improve screening efforts to identify women at high-risk of hereditary ovarian cancers distinct from those associated with BRCA1/2 mutations.
Keywords: CHEK2; MLL4; RPS6KA2; biomarker; cancer driver mutation; cancer sub-type; chemotherapy resistance; diagnostics; gene signature; high-grade serous ovarian carcinoma; mutations; patient’s stratification; prognosis; survival analysis.
Figures
Similar articles
-
FOXM1 expression is significantly associated with chemotherapy resistance and adverse prognosis in non-serous epithelial ovarian cancer patients.J Exp Clin Cancer Res. 2017 May 8;36(1):63. doi: 10.1186/s13046-017-0536-y. J Exp Clin Cancer Res. 2017. PMID: 28482906 Free PMC article.
-
Novel Axl-driven signaling pathway and molecular signature characterize high-grade ovarian cancer patients with poor clinical outcome.Oncotarget. 2015 Oct 13;6(31):30859-75. doi: 10.18632/oncotarget.5087. Oncotarget. 2015. PMID: 26356564 Free PMC article.
-
Screening for BRCA1, BRCA2, CHEK2, PALB2, BRIP1, RAD50, and CDH1 mutations in high-risk Finnish BRCA1/2-founder mutation-negative breast and/or ovarian cancer individuals.Breast Cancer Res. 2011 Feb 28;13(1):R20. doi: 10.1186/bcr2832. Breast Cancer Res. 2011. PMID: 21356067 Free PMC article.
-
miRNA-200a/c as potential biomarker in epithelial ovarian cancer (EOC): evidence based on miRNA meta-signature and clinical investigations.Oncotarget. 2016 Dec 6;7(49):81621-81633. doi: 10.18632/oncotarget.13154. Oncotarget. 2016. PMID: 27835595 Free PMC article. Review.
-
Morphologic, Immunophenotypic, and Molecular Features of Epithelial Ovarian Cancer.Oncology (Williston Park). 2016 Feb;30(2):166-76. Oncology (Williston Park). 2016. PMID: 26892153 Review.
Cited by
-
HLA-G 3' untranslated region variants +3187G/G, +3196G/G and +3035T define diametrical clinical status and disease outcome in epithelial ovarian cancer.Sci Rep. 2019 Apr 1;9(1):5407. doi: 10.1038/s41598-019-41900-z. Sci Rep. 2019. PMID: 30932005 Free PMC article.
-
The BRCA1/2-directed miRNA signature predicts a good prognosis in ovarian cancer patients with wild-type BRCA1/2.Oncotarget. 2015 Feb 10;6(4):2397-406. doi: 10.18632/oncotarget.2963. Oncotarget. 2015. PMID: 25537514 Free PMC article.
-
Developing a genetic signature to predict drug response in ovarian cancer.Oncotarget. 2017 Dec 26;9(19):14828-14848. doi: 10.18632/oncotarget.23663. eCollection 2018 Mar 13. Oncotarget. 2017. PMID: 29599910 Free PMC article.
-
A prognostic model based on DNA methylation-related gene expression for predicting overall survival in hepatocellular carcinoma.Front Oncol. 2024 Jan 18;13:1171932. doi: 10.3389/fonc.2023.1171932. eCollection 2023. Front Oncol. 2024. PMID: 38304027 Free PMC article.
-
Targeting SOD1 induces synthetic lethal killing in BLM- and CHEK2-deficient colorectal cancer cells.Oncotarget. 2015 Sep 29;6(29):27907-22. doi: 10.18632/oncotarget.4875. Oncotarget. 2015. PMID: 26318585 Free PMC article.
References
Publication types
MeSH terms
Substances
LinkOut - more resources
Full Text Sources
Other Literature Sources
Medical
Research Materials
Miscellaneous