

Optimizing the magnetization-prepared rapid gradient-echo (MP-RAGE) sequence
- PMID: 24879508
- PMCID: PMC4039442
- DOI: 10.1371/journal.pone.0096899
Optimizing the magnetization-prepared rapid gradient-echo (MP-RAGE) sequence
Abstract
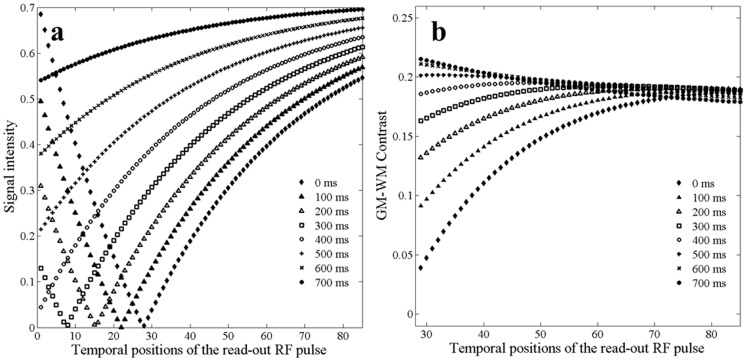
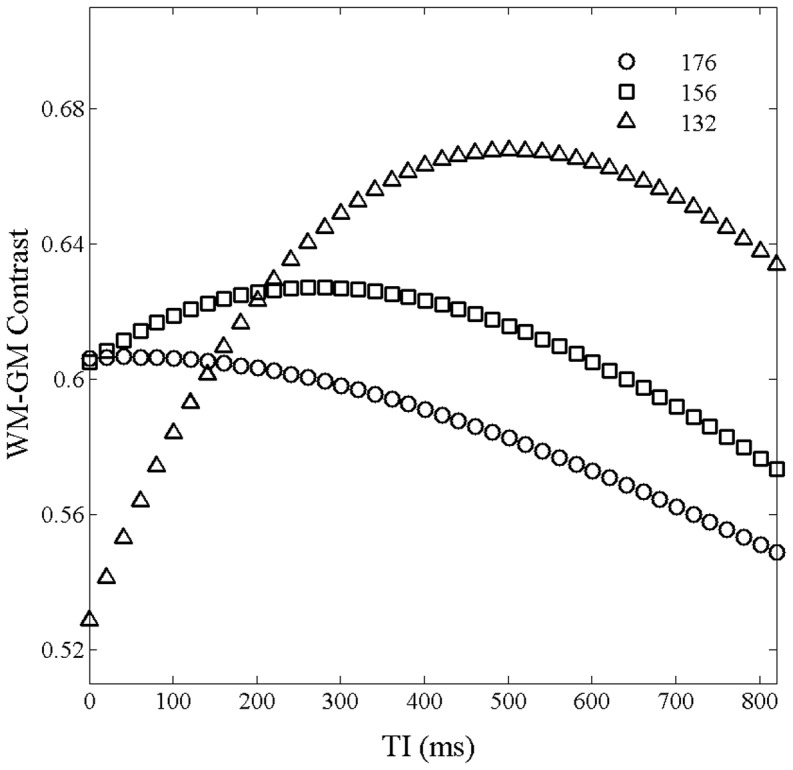
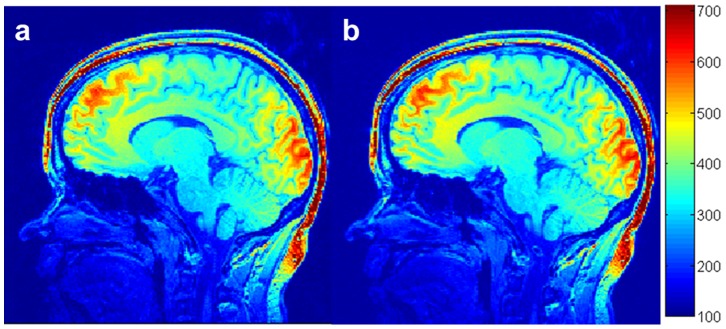
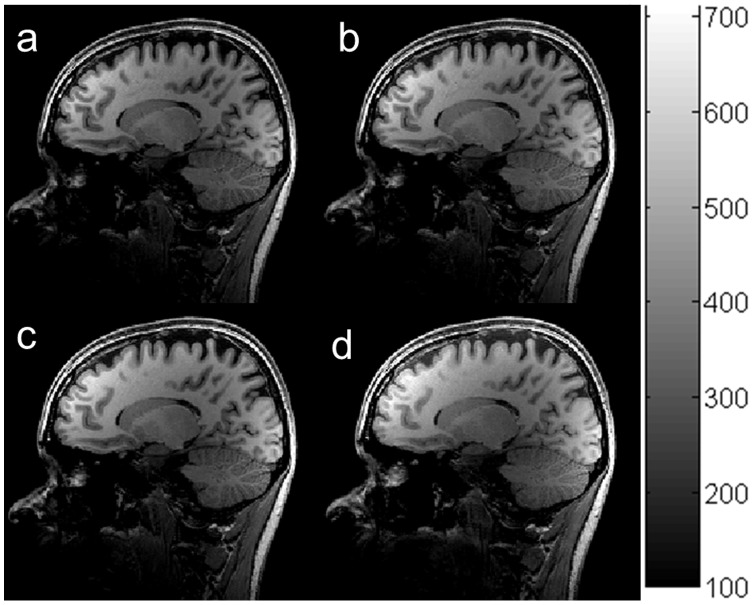
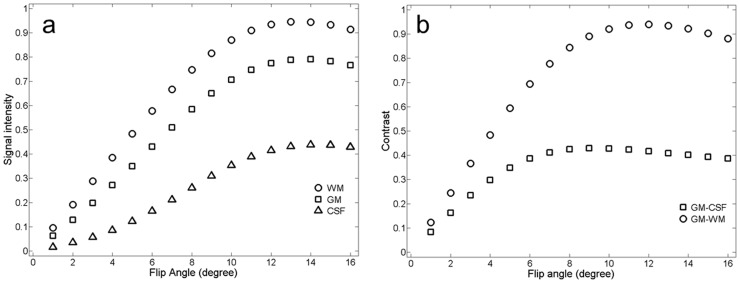
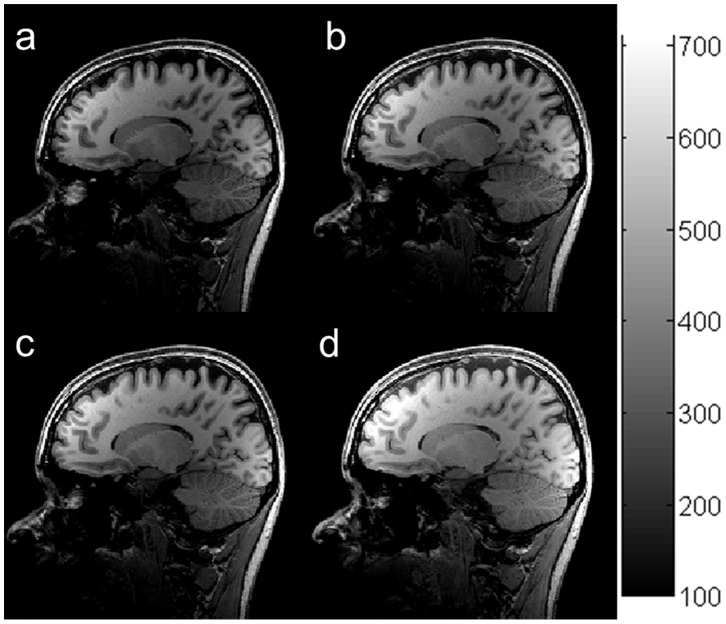
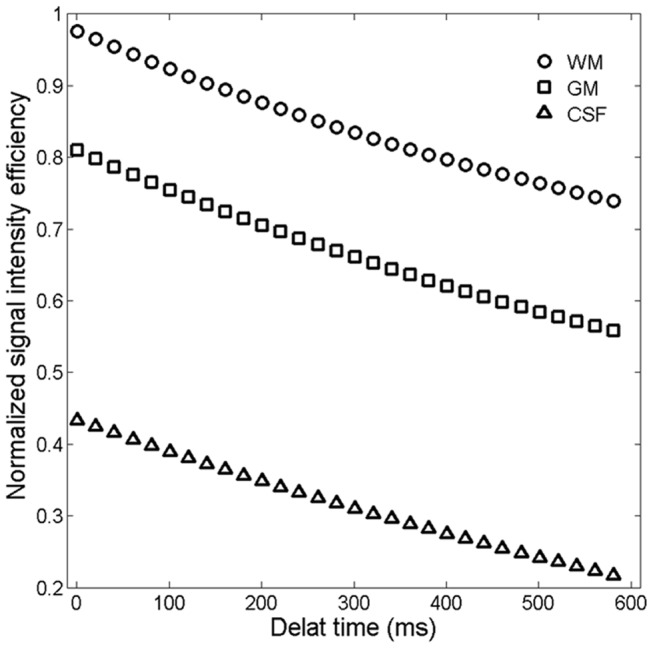
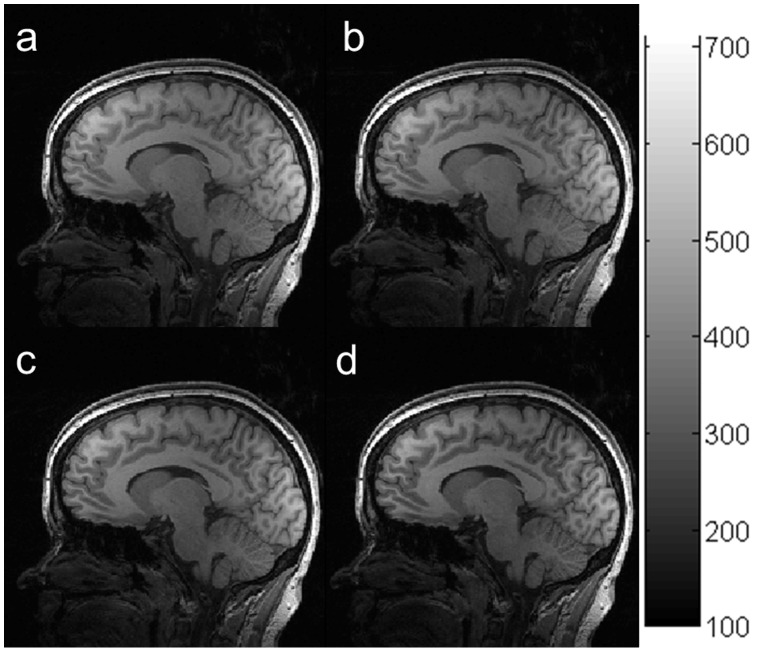
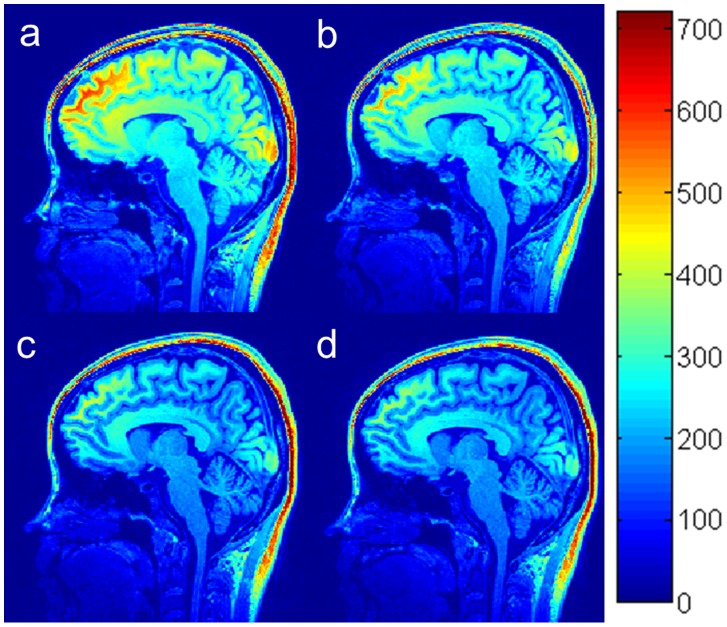
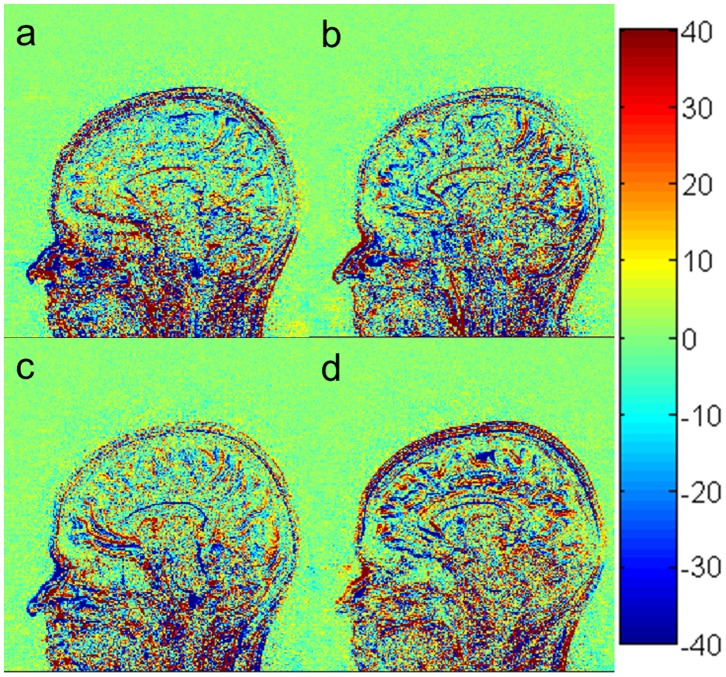
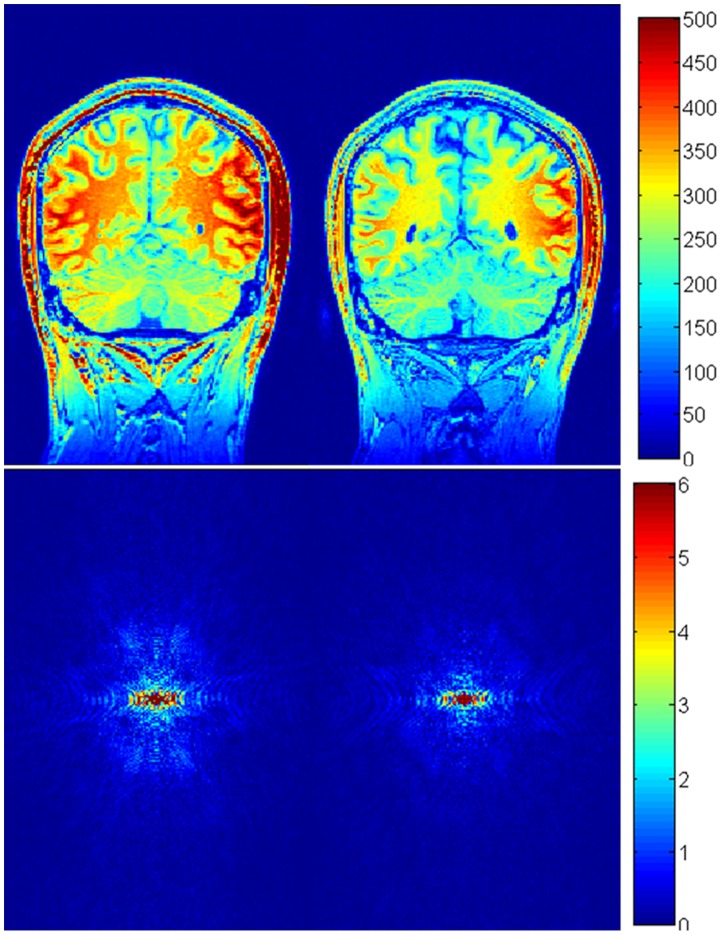
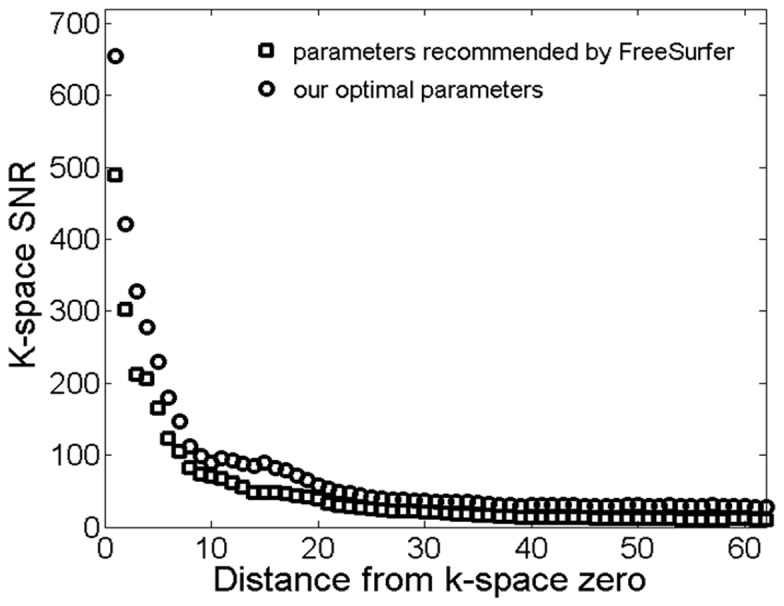
The three-dimension (3D) magnetization-prepared rapid gradient-echo (MP-RAGE) sequence is one of the most popular sequences for structural brain imaging in clinical and research settings. The sequence captures high tissue contrast and provides high spatial resolution with whole brain coverage in a short scan time. In this paper, we first computed the optimal k-space sampling by optimizing the contrast of simulated images acquired with the MP-RAGE sequence at 3.0 Tesla using computer simulations. Because the software of our scanner has only limited settings for k-space sampling, we then determined the optimal k-space sampling for settings that can be realized on our scanner. Subsequently we optimized several major imaging parameters to maximize normal brain tissue contrasts under the optimal k-space sampling. The optimal parameters are flip angle of 12°, effective inversion time within 900 to 1100 ms, and delay time of 0 ms. In vivo experiments showed that the quality of images acquired with our optimal protocol was significantly higher than that of images obtained using recommended protocols in prior publications. The optimization of k-spacing sampling and imaging parameters significantly improved the quality and detection sensitivity of brain images acquired with MP-RAGE.
Conflict of interest statement
Figures
Similar articles
-
Optimization of white-matter-nulled magnetization prepared rapid gradient echo (MP-RAGE) imaging.Magn Reson Med. 2015 May;73(5):1786-94. doi: 10.1002/mrm.25298. Epub 2014 May 29. Magn Reson Med. 2015. PMID: 24889754 Free PMC article.
-
Contrast-enhanced MR imaging of metastatic brain tumor at 3 tesla: utility of T(1)-weighted SPACE compared with 2D spin echo and 3D gradient echo sequence.Magn Reson Med Sci. 2008;7(1):13-21. doi: 10.2463/mrms.7.13. Magn Reson Med Sci. 2008. PMID: 18460844
-
Three-dimensional, T1-weighted gradient-echo imaging of the brain with a volumetric interpolated examination.AJNR Am J Neuroradiol. 2002 Jun-Jul;23(6):995-1002. AJNR Am J Neuroradiol. 2002. PMID: 12063232 Free PMC article.
-
Contrast-enhanced 3-dimensional SPACE versus MP-RAGE for the detection of brain metastases: considerations with a 32-channel head coil.Invest Radiol. 2013 Jan;48(1):55-60. doi: 10.1097/RLI.0b013e318277b1aa. Invest Radiol. 2013. PMID: 23192164
-
Optimization of magnetization-prepared rapid gradient echo (MP-RAGE) sequence for neonatal brain MRI.Pediatr Radiol. 2018 Aug;48(8):1139-1151. doi: 10.1007/s00247-018-4140-x. Epub 2018 May 2. Pediatr Radiol. 2018. PMID: 29721599 Free PMC article.
Cited by
-
Assessment of the Impact of Turbo Factor on Image Quality and Tissue Volumetrics in Brain Magnetic Resonance Imaging Using the Three-Dimensional T1-Weighted (3D T1W) Sequence.Int J Biomed Imaging. 2023 Nov 15;2023:6304219. doi: 10.1155/2023/6304219. eCollection 2023. Int J Biomed Imaging. 2023. PMID: 38025965 Free PMC article.
-
Altered neuronal response to visual food stimuli in adolescents undergoing chronic sleep restriction.Sleep. 2024 Apr 12;47(4):zsad036. doi: 10.1093/sleep/zsad036. Sleep. 2024. PMID: 36805763 Free PMC article.
-
Direct synthesis of multi-contrast brain MR images from MR multitasking spatial factors using deep learning.Magn Reson Med. 2023 Oct;90(4):1672-1681. doi: 10.1002/mrm.29715. Epub 2023 May 28. Magn Reson Med. 2023. PMID: 37246485 Free PMC article.
-
Differential Assessment of Internal Jugular Vein Stenosis in Patients Undergoing CT and MRI with Contrast.Tomography. 2024 Feb 11;10(2):266-276. doi: 10.3390/tomography10020021. Tomography. 2024. PMID: 38393289 Free PMC article.
-
Integrating Demographics and Imaging Features for Various Stages of Dementia Classification: Feed Forward Neural Network Multi-Class Approach.Biomedicines. 2024 Apr 18;12(4):896. doi: 10.3390/biomedicines12040896. Biomedicines. 2024. PMID: 38672253 Free PMC article.
References
-
- Mugler JP, Brookeman JR (1990) Three-dimensional magnetization-prepared rapid gradient-echo imaging (3D MP RAGE). Magn. Reson. Med. 15: 152–157. - PubMed
-
- Ashburner J, Friston KJ (2000) Voxel-based morphometry - The methods. Neuroimage 11: 805–821. - PubMed
-
- Sastre-Garriga J, Arevalo MJ, Renom M, Alonso J, Gonzalez I, et al. (2009) Brain volumetry counterparts of cognitive impairment in patients with multiple sclerosis. J. Neurol. Sci. 282: 120–124. - PubMed
-
- Pell GS, Briellmann RS, Pardoe H, Abbott DF, Jackson GD (2008) Composite voxel-based analysis of volume and T2 relaxometry in temporal lobe epilepsy. Neuroimage 39: 1151–1161. - PubMed
-
- Briellmann RS, Pell GS, Wellard RM, Mitchell LA, Abbott DF, et al. (2003) MR imaging of epilepsy: State of the art at 1.5 T and potential of 3 T. Epileptic Disord. 5: 3–20. - PubMed
Publication types
MeSH terms
LinkOut - more resources
Full Text Sources
Other Literature Sources
Medical
