. 2014 Jul 15;592(14):3089-111.
doi: 10.1113/jphysiol.2013.268136. Epub 2014 May 30.

P2Y1 receptor-mediated potentiation of inspiratory motor output in neonatal rat in vitro

Affiliations

P2Y1 receptor-mediated potentiation of inspiratory motor output in neonatal rat in vitro

T S Alvares et al. J Physiol. .

Abstract

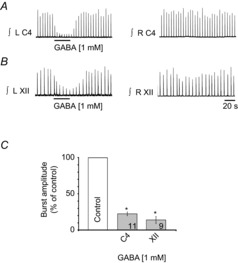
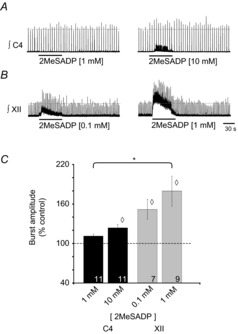
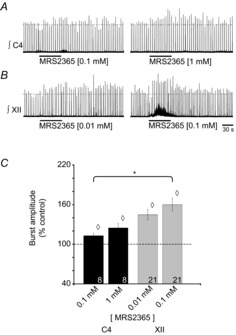
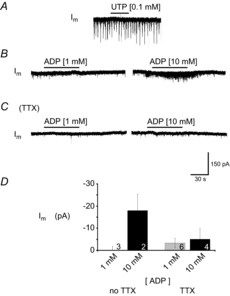
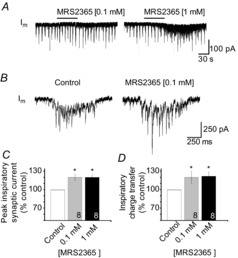
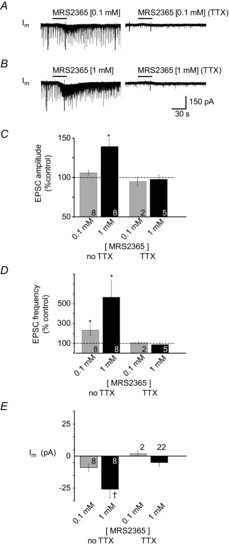
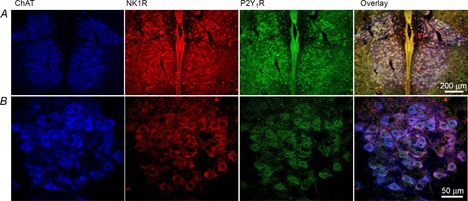
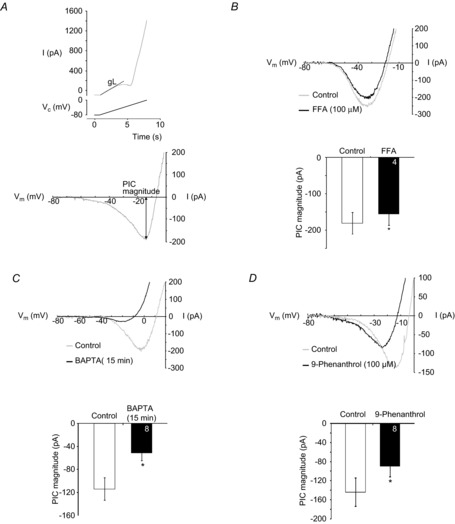
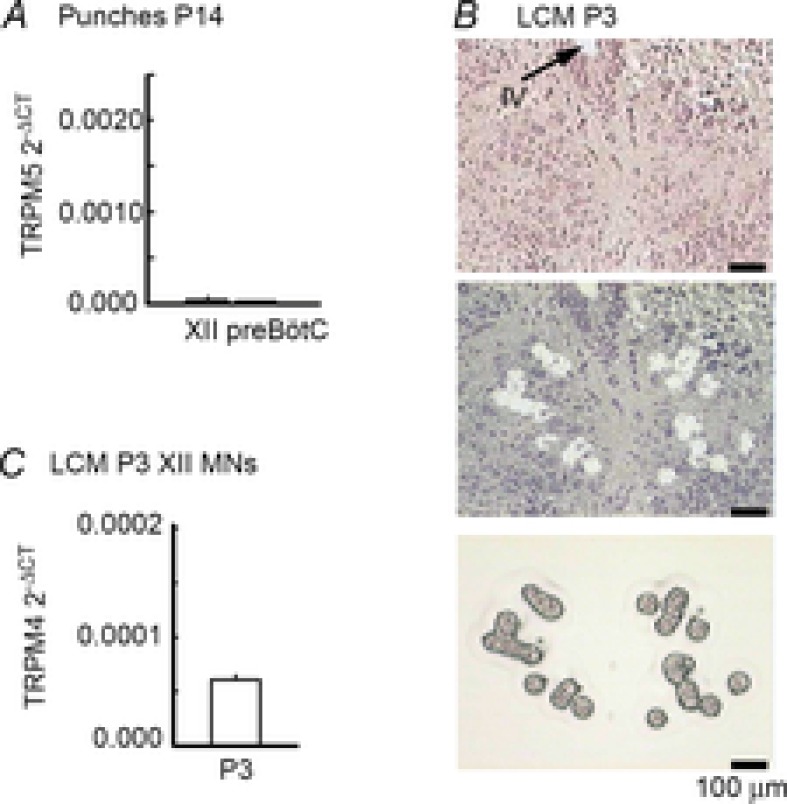
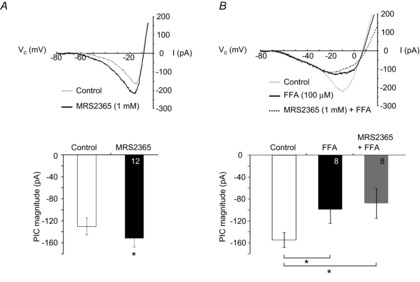
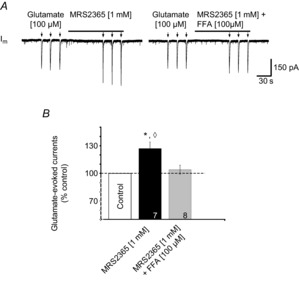
PreBötzinger complex inspiratory rhythm-generating networks are excited by metabotropic purinergic receptor subtype 1 (P2Y1R) activation. Despite this, and the fact that inspiratory MNs express P2Y1Rs, the role of P2Y1Rs in modulating motor output is not known for any MN pool. We used rhythmically active brainstem-spinal cord and medullary slice preparations from neonatal rats to investigate the effects of P2Y1R signalling on inspiratory output of phrenic and XII MNs that innervate diaphragm and airway muscles, respectively. MRS2365 (P2Y1R agonist, 0.1 mm) potentiated XII inspiratory burst amplitude by 60 ± 9%; 10-fold higher concentrations potentiated C4 burst amplitude by 25 ± 7%. In whole-cell voltage-clamped XII MNs, MRS2365 evoked small inward currents and potentiated spontaneous EPSCs and inspiratory synaptic currents, but these effects were absent in TTX at resting membrane potential. Voltage ramps revealed a persistent inward current (PIC) that was attenuated by: flufenamic acid (FFA), a blocker of the Ca(2+)-dependent non-selective cation current ICAN; high intracellular concentrations of BAPTA, which buffers Ca(2+) increases necessary for activation of ICAN; and 9-phenanthrol, a selective blocker of TRPM4 channels (candidate for ICAN). Real-time PCR analysis of mRNA extracted from XII punches and laser-microdissected XII MNs revealed the transcript for TRPM4. MRS2365 potentiated the PIC and this potentiation was blocked by FFA, which also blocked the MRS2365 potentiation of glutamate currents. These data suggest that XII MNs are more sensitive to P2Y1R modulation than phrenic MNs and that the P2Y1R potentiation of inspiratory output occurs in part via potentiation of TRPM4-mediated ICAN, which amplifies inspiratory inputs.


Figures

Figure 1
Figure 1. GABA is equally effective at inhibiting inspiratory burst amplitude in C4 and XII MN pools
Rectified, integrated recordings from left (L) and right (R) C4 (A) and XII (B) nerve rootlets showing the ipsilateral burst amplitude depression produced by a 30 s injection of 1 mm GABA over each MN pool that was used to identify the site for P2Y agonist application. C, group data; numbers for each group are in the bottom of each column. *Significant difference from control; P < 0.05 (post hoc analysis, Bonferroni method).
Figure 2
Figure 2. P2YR activation potentiates inspiratory burst amplitude in C4 and XII MN pools
Rectified, integrated recordings from C4 (A) and XII (B) nerve rootlets, illustrating the burst amplitude potentiation produced by a 60 s injection of 2MeSADP, a P2Y agonist, over the C4 and XII MN pools. C, group data showing increase in burst amplitude evoked by 2MeSADP. Numbers for each group are in the bottom of each column. Dotted line indicates control levels (100%); ◊ indicates significant difference from control; * indicates significant difference between 2MeSADP (1 mm) in C4 and XII pools; P < 0.05 (post hoc analysis, Bonferroni method).
Figure 3
Figure 3. The P2Y1R agonist MRS2365 potentiates inspiratory burst amplitude at C4 and XII nuclei
Rectified, integrated recordings from C4 (A) and XII (B) nerve rootlets, showing the burst amplitude potentiation produced by a 60 s injection of MRS2365, a P2Y1R agonist, over the phrenic and XII MN pools. C, group data showing the effect of MRS2365 on inspiratory burst amplitude. Numbers for each group are in the bottom of each column. Dotted line indicates control levels (100%); ◊ indicates significant difference from control; * indicates significant difference between MRS2365 (0.1 mm) in C4 and XII pools; P < 0.05 (post hoc analysis, Bonferroni method).
Figure 4
Figure 4. XII MNs are insensitive to P2YR agonists UTP and ADP
Whole-cell voltage-clamp recordings from XII MNs held at –60 mV demonstrating the effects produced by a 60 s UTP (A) and ADP application in the absence (B) and in the presence (C) of TTX (0.5 μm). D, group data showing effects of ADP on membrane current (Im). Numbers for each group are in the bottom of each column; results from 1 mm and 10 mm ADP injections were not significantly different, in either absence or presence of TTX (0.5 μm); P > 0.05 (one-way ANOVA).
Figure 5
Figure 5. P2Y1R activation potentiates inspiratory synaptic currents
A, long time-series whole-cell voltage-clamp recordings from an inspiratory XII MN held at –60 mV illustrating the effects on inspiratory synaptic currents of MRS2365 locally applied at 0.1 and 1 mm (60 s). B, inspiratory synaptic current averaged from six consecutive inspiratory cycles in control (left) and during the peak of the response to MRS2365 (60 s, 0.1 mm). C, group data showing the MRS2365-mediated potentiation of inspiratory synaptic currents. Data are reported relative to control as the peak current and charge transfer per inspiratory burst. Numbers for each group are in the bottom of each column; * indicates significant difference from control, P < 0.05 (post hoc analysis, Bonferroni method).
Figure 6
Figure 6. MRS2365 potentiates synaptic activity before but not after application of TTX
Whole-cell voltage-clamp recordings from an inspiratory XII MN showing the effects of MRS2365 locally applied at 0.1 mm (A) and 1 mm (B) before (left) and after (right) bath application of 0.5 μm TTX. Group data show changes in EPSC or mEPSC (in TTX) amplitude (C), EPSC or mEPSC frequency (D) and membrane current (E) evoked by MRS2365 injections depicted in A and B. Numbers for each group are in the bottom of each column; * indicates significant difference from control; † indicates significant difference from MRS2365 (0.1 mm); P < 0.05 (post hoc analysis, Bonferroni method).
Figure 7
Figure 7. XII MNs show P2Y1R immunolabelling
Low- (A) and high-power (B) images of the XII nucleus illustrating XII MN immunolabelling for ChAT (blue), NK1R (red), P2Y1R (green) and the overlays of all three images (right panels).
Figure 8
Figure 8. ICAN contributes to the XII MN persistent inward current (PIC)
A, top panel shows filtered current response of a XII MN (top trace) evoked in response to the depolarizing phase of a voltage ramp (from –80 mV to 0 mV, bottom trace). Leak conductance (gL) (calculated between −80 and −65 mV) is illustrated. Bottom panel illustrates leak-subtracted current and measurement of PIC magnitude. B, top: leak-subtracted current responses evoked by the voltage ramp described in A during local application of vehicle (control) or FFA, using caesium-based intracellular solution. Bottom: group data showing the peak PIC amplitude in control (open) and FFA (100 μm, filled column). Numbers for each group are in the bottom of each column. *P < 0.05 (one-tailed paired t-test). C, top: leak-subtracted current responses evoked by voltage ramps during bath application of TTX (1 μm) at the start of the whole-cell recording with caesium-based, high BAPTA intracellular solution (control) and 15 min later (BAPTA). Bottom: group data showing the peak PIC amplitude in control (open) and after 15 min with high BAPTA (filled column). Numbers for each group are in the bottom of each column. ◊, P < 0.05 (paired t test). D, top: leak-subtracted current responses evoked by voltage ramps during control or during bath application of 9-phenanthrol (100 μm), using caesium-based, low-BAPTA intracellular solution. Bottom: group data showing the peak PIC amplitude during bath application of TTX (1 μm) in control (open) and during bath application of 9-phenanthrol (filled column). Numbers for each group are in the bottom of each column. *P < 0.05 (paired t test).
Figure 9
Figure 9. XII MNs express the transcript for TRPM4
A, mRNA extracted from XII and preBötC tissue punches was subject to real-time PCR analysis for the TRPM5 transcripts. Expression levels are reported relative to cyclophilin A (ΔCT = cycle threshold number for TRPMx – cycle threshold number for cyclophilin A). B, phototriad showing the XII nucleus in a stained tissue section (6 μm) before and after laser-capture microdissection (LCM; Arcturus AutoPIX II) of XII MNs. The image at the bottom is of captured neurons. C, mRNA extracted from laser-captured XII MNs of P3 rats was subject to real-time PCR analysis for the TRPM4 transcripts. Expression levels are reported as described above.
Figure 10
Figure 10. P2Y1R activation potentiates the XII MN PIC through an FFA-sensitive mechanism
A, top: leak-subtracted (filtered) current response showing PIC evoked by slow voltage-ramp in control and during local application of MRS2365 (1 mm), in TTX. Bottom: group data showing peak PIC amplitude evoked during control (open) and after local application of MRS2365 (1 mm, 15 s, black column; n = 12. *P < 0.05, two-tailed paired t test. B, pre-application of 100 μm FFA prevents MRS2365 potentiation of PIC magnitude (in TTX). Top panel: leak-subtracted (filtered) current response showing PIC evoked by slow voltage-ramp in control, after local application of FFA (black line), or after local application of MRS2365 and FFA (dashed black line). Bottom panel: group data showing peak PIC amplitude evoked in control (open), after 2.5 min of locally applied FFA (2.5 min, black column) and after MRS 2365 (1 mm, 15 s) applied at the end of a 2.5 min application of FFA (grey column). *P < 0.05 (post hoc analysis, Newman–Keuls multiple comparison test).
Figure 11
Figure 11. P2Y1R activation potentiates glutamate currents through an FFA-sensitive mechanism
A, voltage-clamp recording of a XII MN held at –60 mV illustrating currents evoked by glutamate puffs (100 μm, 500 ms) in control and in the presence of MRS2365 (left trace), and then again in the presence of MRS2365 and 100 μm FFA (right trace). B, group data showing, relative to control, the change in peak glutamate currents evoked by local application of MRS2365 alone or in combination with FFA. Numbers for each group are in the bottom of each column; * indicates significant difference from control; ◊ indicates significant difference to MRS2365 (1 mm) + FFA (100 μm); P < 0.05 (post hoc analysis, Bonferroni method).

References

    1. Abbracchio MP, Burnstock G, Verkhratsky A, Zimmermann H. Purinergic signalling in the nervous system: an overview. Trends Neurosci. 2009;32:19–29. - PubMed
    1. Adachi T, Huxtable AG, Fang X, Funk GD. Substance P modulation of hypoglossal motoneuron excitability during development: changing balance between conductances. J Neurophysiol. 2010;104:854–872. - PubMed
    1. Adachi T, Robinson DM, Miles GB, Funk GD. Noradrenergic modulation of XII motoneuron inspiratory activity does not involve α2-receptor inhibition of the Ih current or presynaptic glutamate release. J Appl Physiol. 2005;98:1297–1308. - PubMed
    1. Alvarado-Castillo C, Harden TK, Boyer JL. Regulation of P2Y1 receptor-mediated signaling by the ectonucleoside triphosphate diphosphohydrolase isozymes NTPDase1 and NTPDase2. Mol Pharmacol. 2005;67:114–122. - PubMed
    1. Aoyama T, Koga S, Nakatsuka T, Fujita T, Goto M, Kumamoto E. Excitation of rat spinal ventral horn neurons by purinergic P2X and P2Y receptor activation. Brain Res. 2010;1340:10–17. - PubMed

Publication types

Substances

LinkOut - more resources