. 2014 Jul;17(7):934-42.
doi: 10.1038/nn.3734. Epub 2014 Jun 1.

Identification of distinct ChAT⁺ neurons and activity-dependent control of postnatal SVZ neurogenesis

Affiliations

Identification of distinct ChAT⁺ neurons and activity-dependent control of postnatal SVZ neurogenesis

Patricia Paez-Gonzalez et al. Nat Neurosci. 2014 Jul.

Abstract

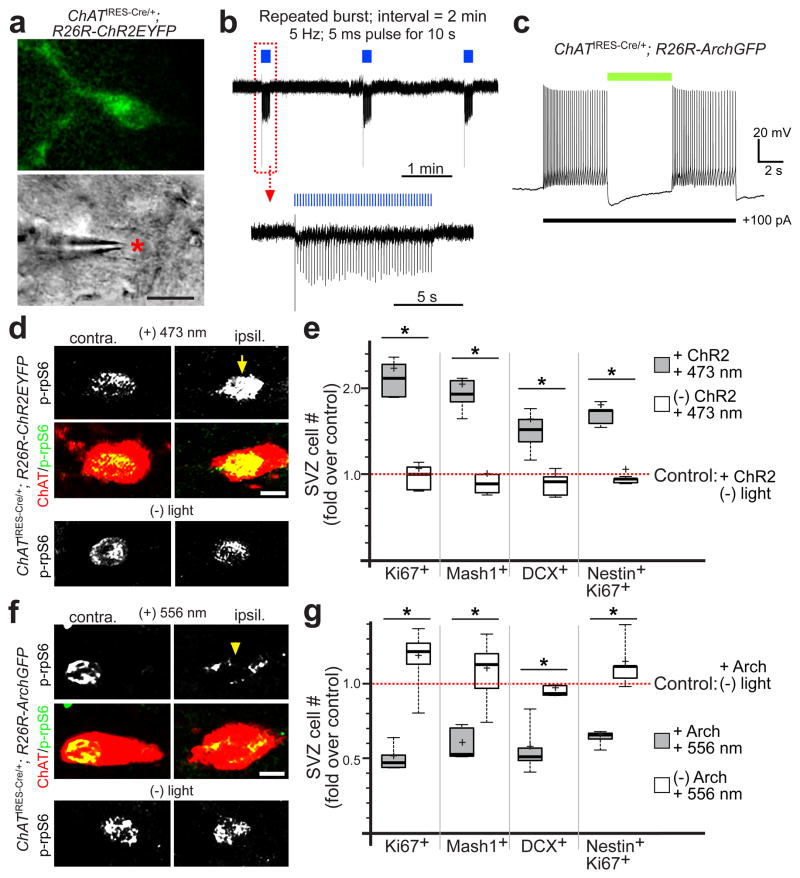
Postnatal and adult subventricular zone (SVZ) neurogenesis is believed to be primarily controlled by neural stem cell (NSC)-intrinsic mechanisms, interacting with extracellular and niche-driven cues. Although behavioral experiments and disease states have suggested possibilities for higher level inputs, it is unknown whether neural activity patterns from discrete circuits can directly regulate SVZ neurogenesis. We identified a previously unknown population of choline acetyltransferase (ChAT)(+) neurons residing in the rodent SVZ neurogenic niche. These neurons showed morphological and functional differences from neighboring striatal counterparts and released acetylcholine locally in an activity-dependent fashion. Optogenetic inhibition and stimulation of subependymal ChAT(+) neurons in vivo indicated that they were necessary and sufficient to control neurogenic proliferation. Furthermore, whole-cell recordings and biochemical experiments revealed direct SVZ NSC responses to local acetylcholine release, synergizing with fibroblast growth factor receptor activation to increase neuroblast production. These results reveal an unknown gateway connecting SVZ neurogenesis to neuronal activity-dependent control and suggest possibilities for modulating neuroregenerative capacities in health and disease.


Conflict of interest statement

Competing Financial Interests

The authors declare no competing financial interests.

Figures

Figure 1
Figure 1. Ank3 deletion in ChAT+ neurons results in postnatal SVZ neurogenesis defects
(a) Representative whole-mount DCX staining of SVZ neuroblast chains, showing neurogenesis defects in P30 Ank3-cKO mutant mice. DCX fluorescence signal inverted to black on white for clarity. R = rostral, C = caudal, D = dorsal, V = ventral, Ctrl = control. (b,c) Close-up views of SVZ DCX neuroblast defects in P14 and P30 whole-mount preparation (b) or P30 coronal sections (c) from Ctrl and Ank3-cKO mice. (d) Representative IHC staining of Ki67 and Mash1 expression in P30 SVZ niche showing decreased Ki67+ and Mash1+ cell numbers in Ank3-cKO mice. (e) Quantifications of SVZ Ki67, Mash1 IHC staining data from P30 Ctrl and Ank3-cKO animals. * P < 0.008, Wilcoxon two-sample test, n = 5, z = 2.611. Box plots show mean (+), median (−), quartiles (boxes), range (whiskers). Scale bars: 100 μm (a), 50 μm (b,c,d).
Figure 2
Figure 2. Identification of subependymal ChAT+ neurons
(a) Imaris 3D-projections of IHC staining from SVZ niche whole-mount from P30 FOXJ1-GFP animal. Red: ChAT+ processes; green: ependymal cells (Ep) visualized by FOXJ1-GFP transgene. Note that the ChAT+ processes are subependymal. Dashed-box indicates neuronal cell body. LV = lateral ventricle. (b) P30 SVZ niche coronal sections from ChATIRES-Cre/+; R26R-tdTomato animals stained with tdTomato antibody. Note the presence of ChAT+ neurons (arrows) beneath ependymal cells (Ep, dashed-lines). (c) Representative DiI-filling of subep-ChAT+ neuron. (Top) En-face ventricular view shows dendritic and axonal processes. (Bottom) Side view of above neuron in 3D reconstruction demonstrates planar arrangement paralleling ependymal surface above (a–b dashed line indicates orientation of side view). (d) Traces from ventricular and coronal section views of representative DiI-filled ChAT+ neurons. Note the planer vs. non-planar morphologies of subependymal vs. striatal ChAT+ neurons in coronal view. Blue lines indicate dendrites, and grey areas represent axonal fields. (e) Quantifications of neuronal morphology from ventricular and coronal views for subependymal (Subep) and striatal (Str) ChAT+ neurons. Traced neurons were fit with an ellipse, and ellipse axis lengths are measured as the long (a) and short axis (b), followed by calculations of axis ratio (a/b). Note the significantly increased axis ratio for subep-ChAT+ neurons in coronal view. * P < 0.002, t18 = 4.469 unpaired Student’s t test, n = 10. Box plots show mean, median, quartiles, range. Scale bars: 30 μm (a), 20 μm (b), 50 μm (c, d).
Figure 3
Figure 3
Defects in subependymal ChAT+ neuron action potential generation and SVZ neurogenesis. (a) Representative current-clamp recordings from subep-ChAT+ neurons in response to 100 ms current pulses (250 pA = green; 500 pA = black trace) in Ank3 Ctrl (top), Het (center), and cKO (bottom) animals. Square trace = duration of current pulse. (b) Quantifications of spike numbers to 100 ms current pulses at 250 or 500 pA; spike threshold; and input resistance in subep-ChAT+ neurons from Ctrl, Het, and cKO animals. * P < 0.0001, t34 = 4.283 (250 pA), t34 = 7.532 (500 pA), ** P < 0.0006, t34 = 3.281, unpaired Student’s t test, n = 18 in all groups (6 animals). Box plots show mean, median, quartiles, range. (c) Mean action potential traces from Ank3 Ctrl, Het, and cKO subep-ChAT+ neurons to 500 pA current injections, showing delayed spiking in cKO neurons. (d) ChAT and tdTomato IHC staining on coronal sections from P30 Nkx2.1-Cre; R26R-tdTomato mice, showing co-localization in striatal (*) but not subep-ChAT+ (arrows) neurons. (e) ChAT and tdTomato IHC staining in subep-ChAT+ neurons from P30 Gsx2-Cre; R26R-tdTomato or Drd2-Cre; R26R-tdTomato mice, showing co-localization with Drd2-Cre driver (arrows). (f) Representative views of ventricular whole-mount DCX staining from P30 Drd2-Cre; ChATflox/+ (Ctrl) and Drd2-Cre; ChATflox/flox (cKO) mice. (g) Representative Ki67, Mash1, DCX IHC staining of SVZ niche from P30 Drd2-Cre; ChATflox/+ (Ctrl) and Drd2-Cre; ChATflox/flox (cKO) mice. Fluorescence signals inverted to black on white for clarity. (h) Quantifications of SVZ Ki67+, Mash1+, DCX+ IHC staining data from (g). * P < 0.008, z = 2.611, Wilcoxon two-sample test, n = 5. Box plots show mean, median, quartiles, range. Scale bars: 15 μm (d,e), 50 μm (f,g).
Figure 4
Figure 4. Electrophysiological properties of subependymal ChAT+ neurons
(a) tdTomato IHC antibody staining of P30 brain coronal section from ChATIRES-Cre/+; R26R-tdTomato animals, showing spatial relationships between subependymal (subep-) and striatal ChAT+ neurons. (b,c) Representative traces of cell attached recordings from striatal (b) or subep- (c) ChAT+ neurons. (d,e) Representative traces of cell-attached recordings from striatal (d) and subependymal (e) ChAT+ neurons in response to 1 second (s) local application of 100 μM glutamate. Bar indicates duration of puffed drug. Peristimulus-time histogram and raster plots for 15 consecutive sweeps, as well as corresponding average spikes per second (mean ± s.e.m.) are shown below, demonstrating baseline spontaneous and glutamate-evoked frequencies. Note the robust spike frequency of subep-ChAT+ neuron during stimulation. Red dashed-lines indicate start of drug application across trials. (f,g) Responses of striatal (f) or subependymal (g) ChAT+ neurons, expressing ChR2EYFP, to 100 ms (top left panel), 10 s (top right panel), or 10 ms (bottom panels) pulses of 473 nm light. Blue bars indicate duration of light-pulse. For 10 ms light pulses, peristimulus-time histogram and raster plots for 15 consecutive sweeps are shown below representative traces. Scale bar: 20 μm (a).
Figure 5
Figure 5. Detecting activity-dependent release of ACh in the SVZ niche
(a) Representative changes in M1-CNiFER fluorescent responses at 475 and 530 nm emission wavelengths, with and without ACh application. Excitation source: 920 nm laser. (b–e) Average traces of M1-CNiFER cell baseline FRET ratios, and ACh- or light-induced changes in FRET ratios (ΔR/R). (b) ACh applied to adherent M1-CNiFER cells in culture. Images sampled once every 2.6 seconds. n = 10. Mean ± s.e.m. (c) ACh applied to M1-CNiFER cells transplanted into SVZ in acute brain slice preparation. Images sampled once every 5.4 seconds. n = 16. Mean ± s.e.m. (d) M1-CNiFER cells transplanted into SVZ niche in acute slice preparation from ChATIRES-Cre/+; R26R-ChR2EYFP mice, followed by 473 nm light-stimulation to activate subep-ChAT+ neurons (5 × 250 ms light pulses, 2 Hz). Images sampled once every 1.6 seconds. n = 14. Mean ± s.e.m. (e) Same focal light-stimulation protocol and slice preparation to image SVZ transplanted M1-CNiFER cells as in (d), but activating striatal ChAT+ neurons adjacent to the SVZ (top trace). Activating striatal ChAT+ neuron at various distances from SVZ: averages of maximum ΔR/R from multiple slice imaging experiments. n = 15. Mean ± s.e.m. Scale bar: 10 μm (a).
Figure 6
Figure 6. SVZ NSCs respond directly to local ACh release
(a) TEM analysis of P30 immunogold-labeled (indicated by black dots) ChAT+ neuronal terminals within SVZ niche. Close-up view showing synaptic vesicles in axon from ChAT+ neuron adjacent to SVZ B-type astrocytic stem cells (B1). * Axon containing synaptic vesicles. (b) Representative voltage-clamp recordings from tdTomato+ SVZ NSCs showing: evoked inward currents following 10 ms 473 nm light pulses @ 15, 30, or 50 Hz for 1 second (top traces, red trace is baseline without light). Optogenetically-stimulated currents are sensitive to cholinergic blockers mecamylamine (Mec., 40 μM), atropine (Atrop., 5 μM), are unaffected by glutamatergic blockers CNQX (10 μM) + APV (100 μM) (black trace), but are abolished by blockade of action potentials (TTX 2 μM, red trace). No light-evoked response was found in tdTomato+ SVZ NSCs using identical experimental conditions from P30 nestin-CreERtm4; R26R-tdTomato mice (without ChAT-ChR2EYFP). Blue bar = duration of light-stimulation train (10 ms pulses, 30 Hz unless otherwise noted). (c) Quantifications of current responses to different light-stimulation frequencies shown in (b), n = 8. Box plots show mean, median, quartiles, range. (d) Quantifications of light-evoked current responses under pharmacological conditions shown in (b). * P < 0.0006, F3,21 = 8.81 (Mec/Atrop), F2,13 = 14.02 (TTX), one-way ANOVA, n ≥ 5 in all groups. Box plots show mean, median, quartiles, range. Scale bar: 250 nm (a).
Figure 7
Figure 7. Optogenetic modulation of SVZ niche cellular proliferation and neurogenesis
(a) Images of ChR2EYFP-expressing subep-ChAT+ neuron (*) and cell-attached configuration. (b) Representative trace of cell-attached recordings from subep-ChAT+ neurons from P30 ChATIRES-Cre/+; R26R-ChR2EYFP mice, responding to pulses of 473 nm light-stimulation. Blue bars indicate duration of light-induction. (c) Optogenetic silencing of subep-ChAT+ neurons during whole-cell recording from ChATIRES-Cre/+; R26R-ArchGFP mice. Neuronal spiking was induced via 15 second, 100 pA depolarizing current (indicated by lower bar). 5 second pulse of 556 nm light (green bar) abolished spiking. (d) Representative p-rpS6 IHC staining of subep-ChAT+ neurons following 48 hrs of 473 nm light-stimulation, comparing induced ipsilateral (ipsil.) to uninduced contralateral (contra.) SVZ, imaged at identical settings from same section. Note the increase in p-rpS6 expression in subep-ChAT+ neuron in light-induced condition (arrow). (e) Quantifications of SVZ Ki67+, Mash1+, DCX+, and Nestin+Ki67+ IHC staining data from ChATIRES-Cre/+; R26R-ChR2EYFP littermates without light-stimulation (control; + ChR2, − light); with light-stimulation (+ ChR2, + 473 nm); and from R26R-ChR2EYFP (no ChATIRES-Cre/+) littermate with light-stimulation (− ChR2, + 473 nm). * P < 0.003, F2,15 = 26.08 (Ki67), F2,15 = 8.91 (Mash1), F2,12 = 14.11 (DCX), F2,12 = 173.7 (Nestin/Ki67), one-way ANOVA, n ≥ 5 in all groups. Box plots show mean, median, quartiles, range. (f) Representative p-rpS6 IHC staining of subep-ChAT+ neurons following 48 hrs of 556 nm light-stimulation, comparing induced ipsilateral to uninduced contralateral SVZ, imaged at identical settings from same section. Note the decrease in p-rpS6 expression in subep-ChAT+ neuron in light-induced condition (arrowhead). Cy5 channel used for p-rpS6 secondary antibody staining, for clarity represented in green channel for co-localization with tdTomato. (g) Quantifications of SVZ Ki67+, Mash1+, DCX+, and Nestin+Ki67+ IHC staining data from ChATIRES-Cre/+; R26R-ArchGFP littermates without light-stimulation (control; + Arch, − light); with light-stimulation (+ Arch, + 556 nm); and from R26R-ArchGFP (no ChATIRES-Cre/+) littermate with light-stimulation (− Arch, + 556 nm). * P < 0.005, F2,15 = 16.85 (Ki67), F2,15 = 13.21 (Mash1), F2,12 = 26.3 (DCX), F2,12 = 28.28 (Nestin/Ki67), one-way ANOVA, n ≥ 5 in all groups. Box plots show mean, median, quartiles, range. Scale bar: 10 μm (a), 5 μm (d,f).

Comment in

Similar articles

Cited by

References

    1. Kelsch W, Sim S, Lois C. Watching synaptogenesis in the adult brain. Annu Rev Neurosci. 2010;33:131–149. - PubMed
    1. Ihrie RA, Alvarez-Buylla A. Lake-front property: a unique germinal niche by the lateral ventricles of the adult brain. Neuron. 2011;70:674–686. - PMC - PubMed
    1. Lazarini F, Lledo PM. Is adult neurogenesis essential for olfaction? Trends Neurosci. 2011;34:20–30. - PubMed
    1. Aboody K, Capela A, Niazi N, Stern JH, Temple S. Translating stem cell studies to the clinic for CNS repair: current state of the art and the need for a Rosetta stone. Neuron. 2011;70:597–613. - PubMed
    1. Robel S, Berninger B, Gotz M. The stem cell potential of glia: lessons from reactive gliosis. Nat Rev Neurosci. 2011;12:88–104. - PubMed

Publication types

MeSH terms

Substances

LinkOut - more resources