. 2014 Jul;15(7):638-45.
doi: 10.1038/ni.2917. Epub 2014 Jun 1.

The transcription factor ThPOK suppresses Runx3 and imposes CD4(+) lineage fate by inducing the SOCS suppressors of cytokine signaling

Affiliations

The transcription factor ThPOK suppresses Runx3 and imposes CD4(+) lineage fate by inducing the SOCS suppressors of cytokine signaling

Megan A Luckey et al. Nat Immunol. 2014 Jul.

Abstract

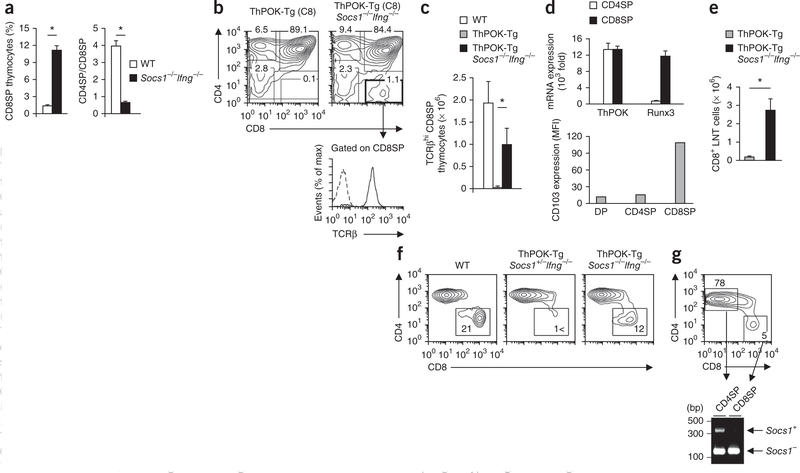
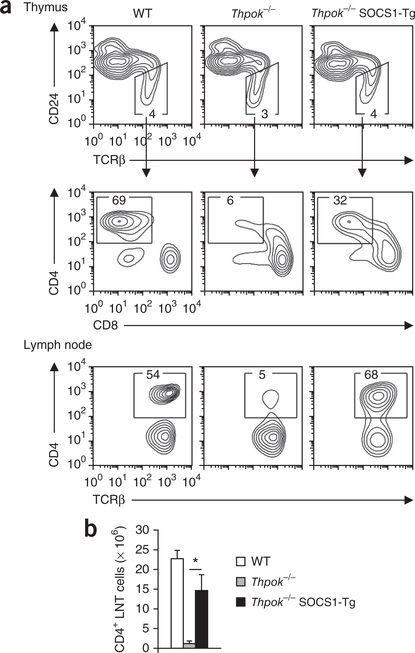
Lineage fate in the thymus is determined by mutually exclusive expression of the transcription factors ThPOK and Runx3, with ThPOK imposing the CD4(+) lineage fate and Runx3 promoting the CD8(+) lineage fate. While it is known that cytokine signals induce thymocytes to express Runx3, it is not known how ThPOK prevents thymocytes from expressing Runx3 and adopting the CD8(+) lineage fate, nor is it understood why ThPOK itself imposes the CD4(+) lineage fate on thymocytes. We now report that genes encoding members of the SOCS (suppressor of cytokine signaling) family are critical targets of ThPOK and that their induction by ThPOK represses Runx3 expression and promotes the CD4(+) lineage fate. Thus, induction of SOCS-encoding genes is the main mechanism by which ThPOK imposes the CD4(+) lineage fate in the thymus.


Conflict of interest statement

COMPETING FINANCIAL INTERESTS

The authors declare no competing financial interests.

Figures

Figure 1
Figure 1
ThPOK induces the expression of genes encoding members of the SOCS family. (a) CD4-versus-CD8 profiles of clonotypic Vα11+ CD24lo T cells from the lymph nodes of AND mice and AND Thpokhd/hd mice. (b) Quantitative RT-PCR analysis of ThPOK and Runx3 mRNA (right) in CD69+CD4+CD8lo INT cells (shaded area, left plots) sorted electronically from AND thymocytes and AND Thpokhd/hd thymocytes (left); mRNA results are presented relative to those of control HPRT mRNA (encoding hypoxanthine guanine phosphoribosyl transferase). (c) Quantitative RT-PCR analysis of SOCS1, SOCS3, Cish and SOCS4 mRNA in mature CD4SP and CD8SP thymocytes sorted from wild-type B6 mice (presented as in b, right). (d) Expression of ThPOK mRNA in CD4+ T cells from the lymph nodes of wild-type mice (WT) and L1, C8 and L6 ThPOK-Tg mice (left), and CD4-versus-CD8 profiles of total thymocytes from those mice (right); mRNA results presented relative to those of wild-type cells, set as 100%. (e) Quantitative RT-PCR analysis of SOCS1, SOCS3, Cish and SOCS4 mRNA in purified CD4+ T cells from lymph nodes of wild-type, L1, C8 and L6 mice, relative to results for HPRT mRNA, plotted against ThPOK mRNA in the same cells and normalized to results for wild-type cells, set as 100%. Numbers adjacent to outlined areas (a,b,d, right) indicate percent cells in each. Data are representative of more than five experiments (a) or three (b,d,e) or four (c) independent experiments (mean and s.e.m. for PCR results).
Figure 2
Figure 2
ThPOK is a transcriptional activator of SOCS-encoding genes. (a) Quantitative RT-PCR analysis of SOCS1, SOCS3, Cish and SOCS4 mRNA in MHC class I–selected T cells purified from lymph nodes of MHC class II–deficient mice (MHCII-KO) and MHC class II–deficient ThPOK-Tg mice (ThPOK-Tg MHCII-KO); results are presented relative to those of MHC class II–deficient cells, set as 100%. (b) Surface expression of the Socs1 reporter protein on T cells from lymph nodes of wild-type mice and C8 or L6 ThPOK-Tg mice, plotted against ThPOK mRNA expression and presented relative to expression in wild-type cells, set as 100%. (c) Firefly luciferase activity in 293T cells transfected with a promoterless firefly luciferase reporter vector containing a genomic DNA fragment corresponding to the mouse Socs1 or Cish promoter plus increasing amounts (horizontal axis) of cDNA encoding wild-type ThPOK (WT ThPOK) or mutant nonfunctional ThPOK with a defect in its BTB-POZ domain (Mut ThPOK); results were normalized to those of cotransfected renilla luciferase and are presented relative to those of untransfected cells, set as 100%. Data are representative of two independent experiments with two mice per group (a; mean and s.e.m.), three independent experiments (b; mean and s.e.m.) or three to five independent experiments (c; mean ± s.e.m. of triplicate assays).
Figure 3
Figure 3
Imposition of the CD4+ lineage fate by ThPOK requires SOCS1. (a) Frequency of CD8SP thymocytes (left) and ratio of CD4SP cells to CD8SP cells (CD4SP/CD8SP; right) in wild-type and SOCS1-deficient (Socs1−/−Ifng−/−) mice. (b) Surface expression of CD4 and CD8 on ThPOK-Tg thymocytes and C8 ThPOK-Tg Socs1−/−Ifng−/− thymocytes (top), and TCRβ expression (solid line) on the CD8SP ThPOK-Tg Socs1−/−Ifng−/− thymocytes gated above (bottom right; dashed line, control antibody). Numbers adjacent to outlined areas (top) indicate percent cells in each. (c) Quantification of TCRβhi CD8SP thymocytes in wild-type, ThPOK-Tg and ThPOK-Tg Socs1−/−Ifng−/− mice. (d) Expression of ThPOK and Runx3 mRNA in CD4SP and CD8SP thymocytes sorted from ThPOK-Tg Socs1−/−Ifng−/− mice, presented relative to that of HPRT mRNA (top), and surface expression of CD103 on CD4+CD8+ double-positive (DP), CD4SP and CD8SP cells from the same mice (bottom). MFI, mean fluorescence intensity. (e) Quantification of CD8+ T cells in lymph nodes (CD8+ LNT cells) from ThPOK-Tg and ThPOK-Tg Socs1−/−Ifng−/− mice. (f) CD4-versus-CD8 profiles of CD24loTCRβhi thymocytes from neonatal (9-day-old) wild-type, ThPOK-Tg Socs1+/−Ifng−/− and ThPOK-Tg Socs1−/−Ifng−/− mice. Numbers in outlined areas indicate percent mature CD8SP cells, quantified as 1,300 ± 414 × 103 cells (wild-type), 65 ± 7 × 10³ cells (ThPOK-Tg Socs1+/−) and 793 ± 38 × 103 cells (ThPOK-Tg Socs1−/−Ifng−/−) (mean ± s.e.m. of three mice per genotype). (g) Donor origins of TCRβhi mature CD4SP and CD8SP cells (top) In an Irradiated Rag2−/− host given a mixture of equal numbers of ThPOK-Tg Socs1+/+ and ThPOK-Tg Socs1−/−Ifng−/− bone marrow stem cells, determined by genotyplng of sorted CD4SP and CD8SP thymocytes by PCR of genomic DNA (bottom). Numbers adjacent to outlined areas (top) indicate percent CD4SP cells (top left) or CD8SP cells (bottom right). * P < 0.001 (Student’s t-test). Data are representative of five independent experiments (a–c,e; mean and s.e.m. of one mouse per group), two independent experiments with two mice per genotype (d; error bars, s.e.m.), three independent experiments (f) or four independent experiments (g).
Figure 4
Figure 4
ThPOK-Tg Socs1−/− thymocytes that adopt the CD8+ cytotoxic T cell fate have minimal expression of any SOCS-encoding gene. (a) Quantitative RT-PCR analysis of SOCS1, SOCS3 and Cish mRNA in CD8+ or CD4+ T cells sorted from ThPOK-Tg Socs1−/−Ifng−/− lymph nodes, presented relative to that of HPRT mRNA. *, SOCS1 mRNA in CD4+ T cells from wild-type lymph nodes. (b) Quantitative RT-PCR analysis of granzyme B (GzmB) mRNA in resting lymph node CD8+ T cells (CD8+ LN T cells) and CD8+ cytotoxic T lymphocytes generated in vitro (CD8+ CTL), purified from B6 and ThPOK-Tg Socs1−/−Ifng−/− mice; results are presented relative to those of HPRT mRNA. (c) Quantitative RT-PCR analysis of ThPOK and Runx3 mRNA in B6 and ThPOK-Tg Socs1−/−Ifng−/− CD8+ cytotoxic T lymphocytes, presented relative to that of mRNA encoding ribosomal protein L13. Data are representative of two independent experiments (mean and s.e.m. of three mice per group).
Figure 5
Figure 5
SOCS1 can replace ThPOK function during commitment to the CD4+ lineage in the thymus. (a) Quantitative RT-PCR analysis of ThPOK and Runx3 mRNA (right) in CD69+CD4+CD8lo INT thymocytes sorted electronically from Thpokhd/hd and Thpokhd/hd SOCS1-Tg mice (left), presented relative to that of HPRT mRNA. (b) Expression of CD4 and CD8 on CD24loTCRβhi thymocytes from Thpokhd/hd and Thpokhd/hd SOCS1-Tg mice (top), and expression of CD4 and TCRβ on TCRβ+ lymph node cells from those mice and a Thpokhd/hd SOCS1-Tg MHC class II–deficient mouse (bottom). Numbers in outlined areas indicate percent CD4SP cells (top) or percent peripheral TCRβ+ CD4+ T cells (bottom). (c) Quantification of CD4+ lymph node T cells (CD4+ LNT cells) from wild-type, Thpokhd/hd and Thpokhd/hd SOCS1-Tg mice. *P < 0.001 (Student’s f-test). Data are representative of two independent experiments (a) or five independent experiments (b,c; mean and s.e.m. in c).
Figure 6
Figure 6
Transgenically expressed SOCS1 can replace ThPOK in the generation of CD4+ T cells. (a) Expression of CD24 and TCRβ by whole thymocytes from wild-type, Thpok−/− and Thpok−/− SOCS1-Tg mice (top) and expression of CD4 and CD8 on the CD24loTCRβhi thymocytes gated above (middle), as well as expression of CD4 and TCRβ on TCRβ+ lymph node cells (bottom). Numbers in outlined areas indicate percent CD24loTCRβhi thymocytes (top) or CD4SP thymocytes (middle) or peripheral TCRβ+ CD4+ T cells (bottom). (b) Quantification of CD4+ lymph node T cells from wild-type, Thpok−/− and Thpok−/− SOCS1-Tg mice. *P < 0.001 (Student’s t-test). Data are representative of seven independent experiments (mean and s.e.m. of seven mice per genotype in b).
Figure 7
Figure 7
ThPOK-independent and ThPOK-dependent generation of CD4+ T cells. (a) Expression of CD4 and CD8 on CD24loVα11hi thymocytes from mice of various genotypes (top) and expression of CD4 and TCRβ by clonotypic Vα11+ lymph node cells (bottom). Numbers in outlined areas indicate percent CD4SP thymocytes (top) or peripheral TCRβ+ CD4+ T cells (bottom). (b) Frequency of cells expressing interleukin 4 (IL-4) and IFN-γ among purified AND CD4+ T cells, AND Thpokhd/hd SOCS1-Tg CD4+ T cells and AND Thpokhd/hd CD8+ T cells exposed for 5 d to T helper type 2-polarizing conditions. (c) Surface expression of the CD40 ligand (CD40L; solid lines) on T cells purified from lymph nodes of B6 and Thpokhd/hd SOCS1-Tg mice and then stimulated overnight with plate-bound antibody to the TCR (5 μg/ml); dashed lines, control antibody. Numbers above bracketed lines indicate percent CD40 ligand-expressing cells. (d) Quantitative RT-PCR analysis of CD4 and ThPOK mRNA (left) and surface expression of CD4 (assessed by flow cytometry; right) by CD4+ T cells sorted electronically from lymph nodes of B6 and Thpok−/−SOCS1-Tg mice, presented relative to results for HPRT mRNA (left) or wild-type cells, set as 100% (right). (e) Surface expression of CD4 on CD4+CD8+ double-positive, INT and CD4SP thymocytes of various genotypes (key), normalized to that of CD4+CD8+ double-positive cells, set as 100%. *P < 0.01 and **P < 0.001 (Student’s t-test). Data are representative of three independent experiments (a,d,e; mean and s.e.m. of three mice per group in d,e) or two independent experiments (b,c).

Similar articles

Cited by

References

    1. Singer A, Adoro S & Park JH Lineage fate and intense debate: myths, models and mechanisms of CD4- versus CD8-lineage choice. Nat. Rev. Immunol 8, 788–801 (2008). - PMC - PubMed
    1. He X et al. The zinc finger transcription factor Th-POK regulates CD4 versus CD8 T-cell lineage commitment. Nature 433, 826–833 (2005). - PubMed
    1. Sun G et al. The zinc finger protein cKrox directs CD4 lineage differentiation during intrathymic T cell positive selection. Nat. Immunol 6, 373–381 (2005). - PubMed
    1. Sato T et al. Dual functions of Runx proteins for reactivating CD8 and silencing CD4 at the commitment process into CD8 thymocytes. Immunity 22, 317–328 (2005). - PubMed
    1. Taniuchi I et al. Differential requirements for Runx proteins in CD4 repression and epigenetic silencing during T lymphocyte development. Cell 111, 621–633 (2002). - PubMed

Publication types

MeSH terms

Substances