. 2014 Dec;32(12):1202-12.
doi: 10.1038/nbt.2877. Epub 2014 Jun 1.

A community effort to assess and improve drug sensitivity prediction algorithms

Collaborators, Affiliations

A community effort to assess and improve drug sensitivity prediction algorithms

James C Costello et al. Nat Biotechnol. 2014 Dec.

Abstract

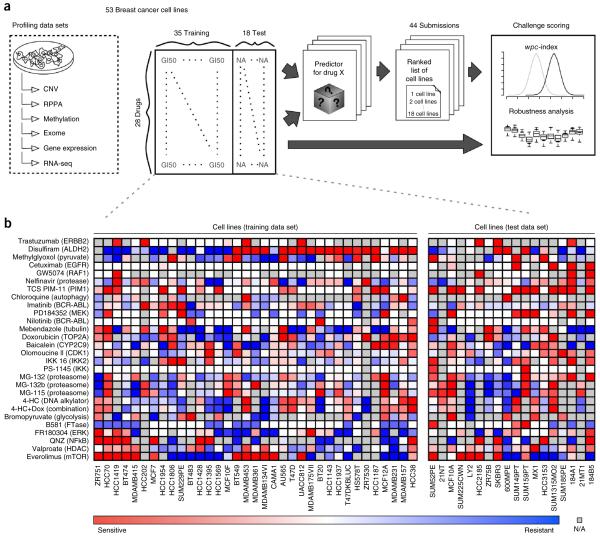
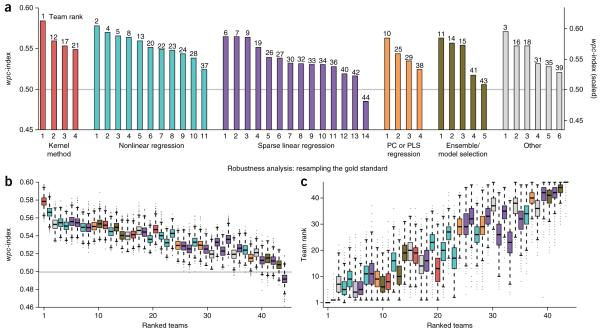
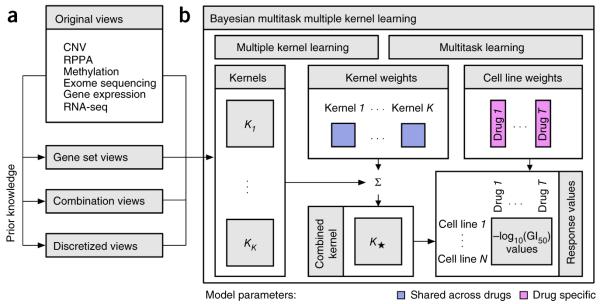
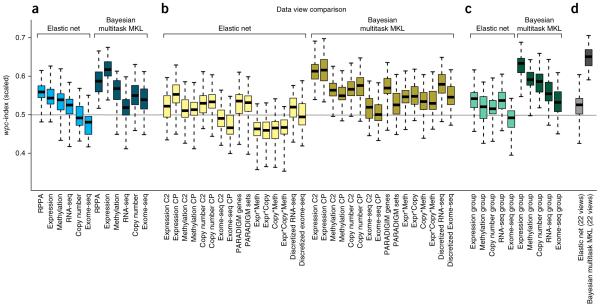
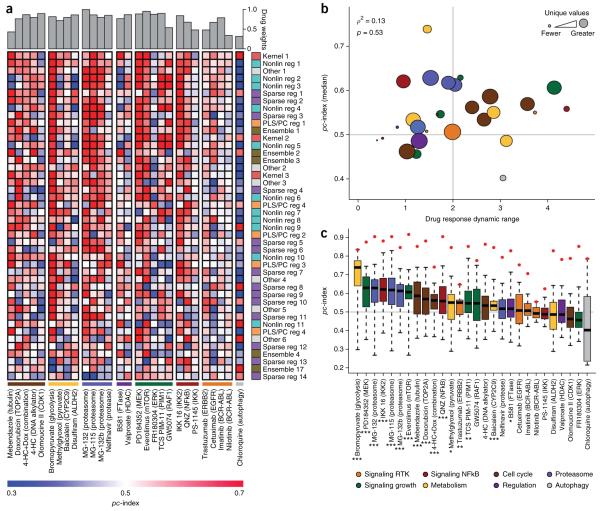
Predicting the best treatment strategy from genomic information is a core goal of precision medicine. Here we focus on predicting drug response based on a cohort of genomic, epigenomic and proteomic profiling data sets measured in human breast cancer cell lines. Through a collaborative effort between the National Cancer Institute (NCI) and the Dialogue on Reverse Engineering Assessment and Methods (DREAM) project, we analyzed a total of 44 drug sensitivity prediction algorithms. The top-performing approaches modeled nonlinear relationships and incorporated biological pathway information. We found that gene expression microarrays consistently provided the best predictive power of the individual profiling data sets; however, performance was increased by including multiple, independent data sets. We discuss the innovations underlying the top-performing methodology, Bayesian multitask MKL, and we provide detailed descriptions of all methods. This study establishes benchmarks for drug sensitivity prediction and identifies approaches that can be leveraged for the development of new methods.


Figures

Figure 1
Figure 1
The NCI-DREAM drug sensitivity challenge. (a) Six genomic, epigenomic, and proteomic profiling data sets were generated for 53 breast cancer cell lines, which were previously described. Drug responses as measured by growth inhibition were assessed after treating the 53 cell lines with 28 drugs. Participants were supplied with all six profiling data sets and dose-response data for 35 cell lines and all 28 compounds (training set). Cell line names were released, but drug names were anonymized. The challenge was to predict the response (ranking from most sensitive to most resistant) for the 18 held-out cell lines (test set). The training and test cell lines were balanced for cancer subtype, dynamic range and missing values (Supplementary Fig. 11). Submissions were scored on their weighted average performance on ranking the 18 cell lines for 28 compounds. (b) Dose-response values for the training and test cell lines displayed as heatmaps.
Figure 2
Figure 2
Evaluation of individual drug sensitivity prediction algorithms. Prediction algorithms (n = 44) are indexed according to Table 1. (a) Team performance was evaluated using the weighted, probabilistic concordance index (wpc-index), which accounts for the experimental variation measured across cell lines and between compounds. Overall team ranks are listed on top of each bar. The gray line represents the mean random prediction score. (b,c) Robustness analysis was performed by randomly masking 10% of the test data set for 10,000 iterations. Performing this procedure repeatedly generates a distribution of wpc-index scores for each team (b). Additionally, after each iteration, teams were re-ranked to create a distribution of rank orders (c). The top two teams were reliably ranked the best and second-best performers (one-sided, Wilcoxon signed-rank test for b and c, FDR « 10−10).
Figure 3
Figure 3
The method implemented by the best performing team. (a) In addition to the six profiling data sets, three different categories of data views were compiled using prior biological knowledge, yielding in total 22 genomic views of each cell line. (b) Bayesian multitask MKL combines nonlinear regression, multiview learning, multitask learning and Bayesian inference. Nonlinear regression: response values were computed not directly from the input features but from kernels, which define similarity measures between cell lines. Each of the K data views was converted into an N×N kernel matrix Kk (k = 1,…,K), where N is the number of training cell lines. Specifically, the Gaussian kernel was used for real-valued data, and the Jaccard similarity coefficient for binary-valued data. Multiview learning: a combined kernel matrix K* was constructed as a weighted sum of the view-specific kernel matrices Kk, k = 1,…,K. The kernel weights were obtained by multiple kernel learning. Multitask learning: training was performed for all drugs simultaneously, sharing the kernel weights across drugs but allowing for drug-specific regression parameters, which for each drug consisted of a weight vector for the training cell lines and an intercept term. Bayesian inference: the model parameters were assumed to be random variables that follow specific probability distributions. Instead of learning point estimates for model parameters, the parameters of these distributions were learned using a variational approximation scheme.
Figure 4
Figure 4
Performance comparison of data set views. The top-performing method, Bayesian multitask MKL, and an elastic net predictor were trained on (a) the original profiling data sets, (b) computed views, (c) groups of data views, and (d) the fully integrated set of all data views. Boxplots represent the distribution of 50 random simulations matching the NCI-DREAM challenge parameters, where whiskers indicate the upper and lower range limit, and the black line, the median. (b) The computed views were derived from gene sets, combined data sets, calculated as the product of values between data sets, and discretizing continuous measures into binary values. (c) Data view groups were defined as all views derived from one profiling data set. (d) For Bayesian multitask MKL, the integration of all data views achieves the best performance. Gene expression is the most predictive profiling data set, slightly outperformed by gene set views of expression data and the integration of original and gene set expression data.
Figure 5
Figure 5
Prediction performance on individual drugs. Prediction algorithms are indexed and colored according to Table 1. (a) The heatplot illustrates participant performance on individual drugs, grouped by drug class (values can be found in Supplementary Table 9). Drug weights, which take into account the number of missing values and the noise in the −log10(GI50) measurements, are displayed at the top of the heatplot. Team submissions are ordered according to their overall performance from best performer at the top of the list. (b) The dynamic range of drugs across all cell lines was compared to the median team score. The node size reflects the number of distinct −log10(GI50) values for each drug across all 53 cell lines. The node colors reflect mode-of-action classes. The gray horizontal line is the mean score of random predictions and the vertical gray line separates low dynamic range (<2) from high dynamic range (>2), where dynamic range for a drug is the maximum −log10(GI50) − minimum −log10(GI50). (c) The distribution of team scores (n = 44) for individual drugs was compared to the null model of random predictions (gray line where pc-index = 0.5). The red points correspond to the maximum possible pc index (pc index of gold standard in the test data). On average, 21/28 drugs performed better than the null model; using the Kolmogorov-Smirnov test, 16/28 drugs were significantly better than the null model (*FDR < 0.05; **FDR < 0.01; ***FDR < 0.001).

References

    1. Barretina J, et al. The Cancer Cell Line Encyclopedia enables predictive modelling of anticancer drug sensitivity. Nature. 2012;483:603–607. - PMC - PubMed
    1. Cancer Genome Atlas Network Comprehensive molecular portraits of human breast tumours. Nature. 2012;490:61–70. - PMC - PubMed
    1. Garnett MJ, et al. Systematic identification of genomic markers of drug sensitivity in cancer cells. Nature. 2012;483:570–575. - PMC - PubMed
    1. Heiser LM, et al. Subtype and pathway specific responses to anticancer compounds in breast cancer. Proc. Natl. Acad. Sci. USA. 2012;109:2724–2729. - PMC - PubMed
    1. International Cancer Genome Consortium et al. International network of cancer genome projects. Nature. 2010;464:993–998. - PMC - PubMed

Publication types

MeSH terms

Substances

Associated data