. 2014 Jul;16(7):708-15.
doi: 10.1038/ncb2981. Epub 2014 Jun 1.

FHOD1 interaction with nesprin-2G mediates TAN line formation and nuclear movement

Affiliations

FHOD1 interaction with nesprin-2G mediates TAN line formation and nuclear movement

Stefan Kutscheidt et al. Nat Cell Biol. 2014 Jul.

Abstract

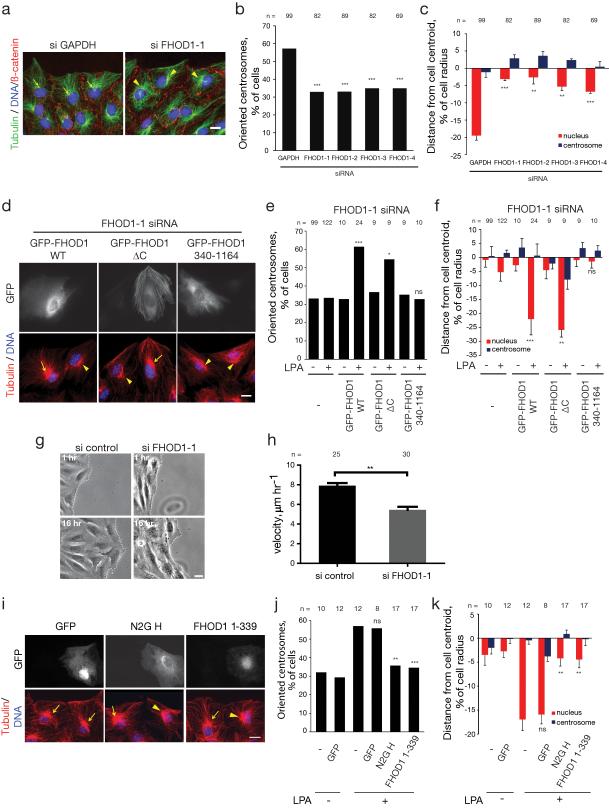
Active positioning of the nucleus is integral to division, migration and differentiation of mammalian cells. Fibroblasts polarizing for migration orient their centrosomes by actin-dependent nuclear movement. This nuclear movement depends on nesprin-2 giant (N2G), a large, actin-binding outer nuclear membrane component of transmembrane actin-associated (TAN) lines that couple nuclei to moving actin cables. Here, we identify the diaphanous formin FHOD1 as an interaction partner of N2G. Silencing FHOD1 expression or expression of fragments containing binding sites for N2G or FHOD1 disrupted nuclear movement and centrosome orientation in polarizing fibroblasts. Unexpectedly, silencing of FHOD1 expression did not affect the formation or rearward flow of dorsal actin cables required for nuclear positioning. Rather, N2G-FHOD1 interaction provided a second connection to actin cables essential for TAN line formation and thus nuclear movement. These results reveal a unique function for a formin in coupling an organelle to actin filaments for translocation, and suggest that TAN lines require multi-point attachments to actin cables to resist the large forces necessary to move the nucleus.


Figures

Figure 1
Figure 1
FHOD1 interacts with N2G. (a) Schematic representation of the interaction site between human FHOD1 and N2G identified by yeast two hybrid is shown mapped onto mouse N2G and is indicated by the dotted box. The letters above N2G refer to fragments used for the directed yeast two hybrid in d. Domains in FHOD1 are: GBD, GTPase binding domain; DID, Diaphanous inhibitory domain; ABS, actin binding site; FH1, formin homology 1 domain; FH2, formin homology 2 domain; DAD, Diaphanous autoregulatory domain. (b) Pull down of HA-FHOD1 constructs with GST-N2G 1340-1678. HEK293T cell lysates containing the indicated HA-FHOD1 constructs were pulled down with GST-N2G 1340-1678 or GST and analysed by western blotting (WB) with HA or GST antibody. (c) Coimmunoprecipitation of HA-FHOD1 WT with antibody to endogenous N2G (or unrelated His antibody as a control) from lysates of transfected 293T cells. Immunoprecipitates were analysed by western blotting with antibodies to HA and N2G. (d) Directed membrane yeast two hybrid with the N2G fragments as baits and FHOD1 1-339 as prey and positive and negative controls. Triplicates at increasing dilution are shown. Only fragment H interacted above background level with FHOD1 1-339. Bar, 5 mm. (e) Pull down of HA-FHOD1 1-339 with indicated SRs from the interacting region of N2G. The evolutionary conservation of the residues in each of the SRs is indicated (see Methods and Supplementary Fig. 1). Lysates from 293T cells expressing HA-FHOD1 1-339 were pulled down with the indicated GST- tagged N2G SR constructs or GST alone and analysed by Western blotting with an antibody to HA. Coomassie staining is shown for GST loads.
Figure 2
Figure 2
FHOD1 is required for nuclear movement. (a) Immunofluorescence images of LPA- stimulated, wounded monolayers of NIH3T3 fibroblasts depleted of GAPDH or FHOD1. The wound is towards the top in this and all subsequent figures. Arrows and arrowheads indicate oriented and non-oriented centrosomes, respectively. (b) Quantification of centrosome orientation in the experiment shown in a. Centrosome orientation between the leading edge and nucleus was scored as described, ; random orientation is 33% by this measure. (c) Quantification of centrosome and nucleus position along the front-back axis in LPA- stimulated NIH3T3 fibroblasts depleted of GAPDH or FHOD1. The cell centroid is defined as “0”; positive values, toward the leading edge; negative, away. Data in a-c are from 3 experiments; n = number of cells analysed per experiment in this and subsequent panels. (d) Immunofluorescence images of LPA-stimulated, wounded monolayers of FHOD1-1 siRNA treated NIH3T3 fibroblasts re-expressing the indicated FHOD1 constructs. Arrows indicate oriented centrosomes; arrowheads, non-oriented centrosomes. (e) Quantification of centrosome orientation in the experiment shown in d. (f) Analysis of centrosome and nucleus position in the experiment shown in d. Data in d-f are from 3 experiments. (g) Images from a phase contrast movie of NIH3T3 fibroblast migrating into wounds after treatment with FHOD1-1 siRNA or scrambled siRNA control. The dashed line shows the wound edge. (h) Velocity of wound closure in NIH3T3 fibroblasts treated with FHOD1-1 siRNA or scrambled siRNA control. Data are from 3 individual experiments. (i) Immunofluorescence images of LPA-stimulated, wounded monolayers of NIH3T3 fibroblasts expressing interacting regions of N2G or FHOD1. Arrows indicate oriented centrosomes; arrowheads, non-oriented centrosomes. (j) Quantification of centrosome orientation in the experiment shown in i. (k) Analysis of centrosome and nucleus position in the experiment shown in i. Data in i-k are from 4 experiments. Bars, a, d, g, i: 10 μm. Error bars for c,f,h,k: SEM. The n number of cells analysed is shown in (b, c, e, f, h, j, k) ***, P<0.001; **, P<0.01; *, P<0.05; ns, not significantly difference by Fisher’s exact test (b,e,j) and two-tailed t-test (c,f,h,k).
Figure 3
Figure 3
FHOD1 is dispensable for formation of dorsal actin cables and retrograde actin flow. (a, b) Fluorescence images of F-actin (phalloidin) and DNA (DAPI) in LPA-stimulated NIH3T3 fibroblasts treated with (a) control or (b) FHOD1 siRNAs. Time in min after LPA stimulation is shown at top. Zoomed images of the outlined regions in the 60 min time point show dorsal actin cables over the nucleus. (c-e) Quantification of (c) the number of dorsal actin cables above nuclei, (d) nuclear phalloidin intensity, and (e) cytosolic phalloidin intensity in NIH3T3 fibroblasts treated with control or FHOD1 siRNAs and stimulated with LPA for the indicated time. Data in a-e are from 5 experiments; n = number of cells analysed per experiment in these and subsequent panels. (f) Kymographs from movies of Lifeact-GFP stably expressed in NIH3T3 fibroblasts treated with control or FHOD1-specific siRNA. Time (min) is shown above the kymograph; each panel is 5 min. Arrows, retrogradely moving dorsal actin cables; dashed circles, position of nucleus. (g) Velocity of actin cable retrograde flow in NIH3T3 fibroblasts treated with control or FHOD1 siRNAs determined from kymographs as in (f). Data are from 3 experiments. Bars, a,b: 10 μm; f, 5 μm. Error bars (c-e, g), SEM. The n number of cells analysed is shown in (c-e, g). ns, not significantly different by two-tailed t-test.
Figure 4
Figure 4
FHOD1 is essential for TAN line formation. (a) Fluorescence images of the indicated RFP-FHOD1 constructs or RFP as a control and GFP-mN2G (a TAN line marker) on the dorsal surface of wound edge NIH3T3 fibroblasts. Arrowheads, FHOD1 colocalizing with mN2G in TAN lines. (b) Fluorescence images of GFP-mN2G and F-actin (phalloidin) on the dorsal surface of wound edge NIH3T3 fibroblasts treated with control or FHOD1 siRNA. Arrowheads, TAN lines with colocalized GFP-mN2G and F-actin. (c) Quantification of the frequency of wound-edge NIH3T3 fibroblasts with TAN lines following treatment with the indicated siRNAs. Data are from 3 experiments; n = number of cells analysed per experiment in (c). Bars, a,b: 10 μm. (c) ***, P<0.001; **, P<0.01 by Fisher's exact test.
Figure 5
Figure 5
The N-terminal actin binding site of FHOD1 provides N2G with an additional contact to actin filaments required for TAN line formation. (a) Schematic of constructs used. (b) Immunofluorescence images of LPA-stimulated, wounded monolayers of FHOD1-1 siRNA treated NIH3T3 fibroblasts expressing the indicated constructs and stained for GFP, Tyr tubulin, and DNA (DAPI). Arrows indicate oriented centrosomes; arrowheads, non-oriented centrosomes. (c) Quantification of centrosome orientation in the experiment shown in (b). (d) Analysis of centrosome and nucleus position in the experiment shown in (b). Data in b-d are from 3 experiments; n = number of cells analysed per experiment. (e) Immunofluorescence images of the indicated GFP constructs and F-actin (phalloidin) over nuclei of wound-edge NIH3T3 fibroblasts depleted of FHOD1. Arrowheads, examples of expressed GFP protein colocalizing with dorsal actin cables over the nucleus. (f) Model of multivalent connection of N2G to actin filaments established by FHOD1-N2G interaction. N2G's paired CH domains provide one connection to the actin filament; FHOD1 associated with N2G provides a second actin filament binding site through its N-terminal ABS. FHOD1 is enlarged relative to N2G to allow depiction of its domains. Bars, b,e: 10 μm. Error bars d: SEM. **, P < 0.01; *, P < 0.05; The n number of cells analysed is shown in (c, d) ns, not significantly different by Fisher's exact test (c) and two-tailed t-test (d).

Similar articles

Cited by

References

    1. Gundersen GG, Worman HJ. Nuclear positioning. Cell. 2013;152:1376–1389. - PMC - PubMed
    1. Gomes ER, Jani S, Gundersen GG. Nuclear movement regulated by Cdc42, MRCK, myosin, and actin flow establishes MTOC polarization in migrating cells. Cell. 2005;121:451–463. - PubMed
    1. Luxton GW, Gomes ER, Folker ES, Vintinner E, Gundersen GG. Linear arrays of nuclear envelope proteins harness retrograde actin flow for nuclear movement. Science. 2010;329:956–959. - PMC - PubMed
    1. Chesarone MA, DuPage AG, Goode BL. Unleashing formins to remodel the actin and microtubule cytoskeletons. Nat. Rev. Mol. Cell Biol. 2010;11:62–74. - PubMed
    1. Bartolini F, Gundersen GG. Formins and microtubules. Biochim. Biophys. Acta. 2010;1803:164–173. - PMC - PubMed

Publication types

MeSH terms