. 2014 Jul;42(12):7611-24.
doi: 10.1093/nar/gku458. Epub 2014 May 31.

A SET-domain-independent role of WRAD complex in cell-cycle regulatory function of mixed lineage leukemia

Affiliations

A SET-domain-independent role of WRAD complex in cell-cycle regulatory function of mixed lineage leukemia

Aamir Ali et al. Nucleic Acids Res. 2014 Jul.

Abstract

MLL, the trithorax ortholog, is a well-characterized histone 3 lysine 4 methyltransferase that is crucial for proper regulation of the Hox genes during embryonic development. Chromosomal translocations, disrupting the Mll gene, lead to aggressive leukemia with poor prognosis. However, the functions of MLL in cellular processes like cell-cycle regulation are not well studied. Here we show that the MLL has a regulatory role during multiple phases of the cell cycle. RNAi-mediated knockdown reveals that MLL regulates S-phase progression and, proper segregation and cytokinesis during M phase. Using deletions and mutations, we narrow the cell-cycle regulatory role to the C subunit of MLL. Our analysis reveals that the transactivation domain and not the SET domain is important for the S-phase function of MLL. Surprisingly, disruption of MLL-WRAD interaction is sufficient to disrupt proper mitotic progression. These mitotic functions of WRAD are independent of SET domain of MLL and, therefore, define a new role of WRAD in subset of MLL functions. Finally, we address the overlapping and unique roles of the different SET family members in the cell cycle.


Figures

Figure 1.
Figure 1.
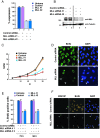
MLL loss-of-function leads to growth arrest. (A) RT-qPCR was carried out to analyze mRNA transcript levels of MLL in cells transfected with two different MLL siRNAs (siRNA #1 or siRNA #2). Untransfected and luciferase siRNA-transfected cells were used as control. Transcripts were normalized to the housekeeping gene GAPDH by using −ΔΔCT method and percentage expression relative to untransfected sample is shown. (B) Immunoblot analysis of MLL knockdown was done using MLL siRNA #1 or siRNA #2. Untransfected and luciferase siRNA-transfected cells were used as control. The blot was probed with anti-MLL and anti-tubulin antibody. 180 and 55: molecular weight markers. (C) Growth curves of untransfected (black), control siRNA-transfected (orange) or MLL siRNA [siRNA #1(red) or #2 (blue)]-transfected U2OS cells were generated by plotting the total number of live cells (Nt) divided by number of cells seeded on day 0 (N0). The cells were harvested at 24, 48, 72 and 96 h from duplicate experiments after siRNA treatment, stained with trypan blue, counted, and averaged results are shown. (D) Immunofluorescence analysis of BrdU incorporation in control or MLL siRNA-transfected cells was done by staining cells with anti-BrdU antibody and DAPI. Arrowheads point to BrdU-negative cells. Scale: 5 μm. (E) Quantification of BrdU-positive cells was done in untransfected, control siRNA, MLL siRNA #1- or MLL siRNA #2-transfected cells 72 or 96 h after treatment. (A, C, E) Data are represented as mean ± SD. (F) BrdU incorporation and cell-cycle phase analysis in control or MLL siRNA-transfected cells was done by staining cells with anti-BrdU or anti-H3S10P antibody and DAPI. Closed arrowheads point to H3S10P and BrdU-positive cells. Open arrowheads point to BrdU-negative cells. Scale: 5 μm.
Figure 2.
Figure 2.
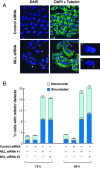
MLL depletion leads to mitotic defects. (A) Immunofluorescence analysis showing mitotic defects (binucleation and micronuclei) upon MLL depletion in U2OS cells. The cells were stained with DAPI and anti-tubulin antibody. Closed arrowheads and panel a show binucleated cells; open arrowheads and panel b show cells with micronuclei. Scale: 5 μm. (B) The percentage of the U2OS cells displaying mitotic defects was quantified in untransfected, control siRNA, MLL siRNA #1- or MLL siRNA #2-transfected cells 72 or 96 h after treatment. Data are represented as mean ± SD. Significant P-values (<0.01) were obtained with Student's t-test.
Figure 3.
Figure 3.
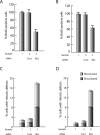
MLL RNAi gives rise to cell proliferation and mitotic defects in MCF7 and IMR-90tert cells. (AB). BrdU labeling was done in MCF7 (A) and IMR-90tert (B) cells following MLL depletion by siRNA. The untransfected (−), control siRNA (cont) and MLL siRNA#1(MLL)-transfected cells were stained with anti-BrdU 72 h after treatment. Data are represented as mean ± SD. (CD). Percentage of cells displaying mitotic defects (binucleation and micronuclei) in MCF7 (C) and IMR-90tert (D) cells upon MLL siRNA treatment. Untransfected, control siRNA and MLL siRNA #1-transfected cells were stained with DAPI and anti-tubulin antibody 72 h after siRNA treatment. Data are represented as mean ± SD. Significant P-values (<0.006) were obtained with Student's t-test.
Figure 4.
Figure 4.
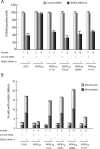
RNAi of WRAD complex leads to cell proliferation and mitotic defects. (A) The model of functional MLL HMT core complex. WRAD interacts with MLLC subunit. WDR5 forms a bridge by interacting with MLLC subunit on one side and RbBP5 on other (27,34). (B) BrdU incorporation assay was performed in U2OS cells following depletion of each component of WRAD complex by using two different siRNAs for each protein. The untransfected, control siRNA, WDR5 siRNA (#1 or #2), RbBP5 siRNA (#1 or #2), Ash2L siRNA (#1 or #2) and Dpy30 siRNA (#1 or #2)-transfected cells were subjected to long-term BrdU labeling. The cells were harvested at 72 and 96 h after siRNA treatment and stained with DAPI and anti-BrdU antibody. Data are represented as mean ± SD. (C) Percentage of cells displaying binucleation (dark blue and orange) and micronuclei (light blue and apricot) upon siRNA treatment. The cells were transfected with siRNA as indicated and stained with DAPI and anti-tubulin 72 or 96 h after siRNA transfection. Data are represented as mean ± SD. Significant P-values (<0.01) were obtained with Student's t-test.
Figure 5.
Figure 5.
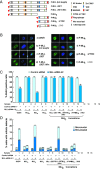
MLLC subunit rescues cell proliferation and mitotic defects in MLL-depleted cells. (A) The figure shows schematic representation of MLL full-length protein with various domains. Recombinant full-length and mutant MLL proteins were expressed with Flag-epitope-tag (F) fused at their N terminal. (B) The expression of ectopic MLL full-length and mutant proteins was checked by immunofluorescence. The U2OS cells were fixed and immunostained with anti-Flag serum to detect expressed Flag-tagged recombinant MLL (full-length) and mutant constructs in (a) wild-type cells (as control), and, cells expressing (b) F-MLL representing recombinant full-length precursor protein; (c) F-MLL ΔSET lacking the SET domain; (d) F-MLL ΔSETΔWin lacking the SET domain and point mutation in Win motif (R3765A); (e) F-MLLN representing the N subunit; (f) F-MLLC representing the C subunit; (g) F-MLLC ΔFYRC lacking the FYRC region and (h) F-MLLC ΔTAD lacking the TAD. Scale: 5 μm. BrdU staining (C) and mitotic defects (D) quantifications were done in U2OS cells and stable cell lines expressing full-length or mutant MLL protein following treatment with control siRNA or MLL siRNA #2 for 72 h. Data are represented as mean ± SD. Significant P-values (<0.01) were obtained with Student's t-test (D).
Figure 6.
Figure 6.
Mutational analysis of WDR5 protein. (A and B) U2OS cells and cells stably expressing siRNA-resistant full-length or point mutants of WDR5 protein were treated with WDR5 siRNA #2 for 72 h and scored for BrdU incorporation (A) and mitotic defects (B) as described earlier. Data are represented as mean ± SD. Significant P-values (<0.004) were obtained with Student's t-test (B).
Figure 7.
Figure 7.
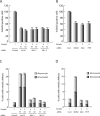
SET1 family regulates cell growth and mitosis. (AD) Different members of SET1 family were knocked down using siRNA and BrdU incorporation assay (A-B) and mitotic defects analyses (C-D) were done in U2OS cells as indicated. (A,C) #1 and #2 denote two different siRNAs used. Cont, control; Men, Menin; Wd82, WDR82. Significant P-values (<0.01) were obtained with Student's t-test (C-D).

References

    1. Hess J.L. MLL: a histone methyltransferase disrupted in leukemia. Trends Mol. Med. 2004;10:500–507. - PubMed
    1. Yu B.D., Hess J.L., Horning S.E., Brown G.A., Korsmeyer S.J. Altered Hox expression and segmental identity in Mll-mutant mice. Nature. 1995;378:505–508. - PubMed
    1. Ang Y.S., Tsai S.Y., Lee D.F., Monk J., Su J., Ratnakumar K., Ding J., Ge Y., Darr H., Chang B., et al. Wdr5 mediates self-renewal and reprogramming via the embryonic stem cell core transcriptional network. Cell. 2011;145:183–197. - PMC - PubMed
    1. Hsieh J.J., Ernst P., Erdjument-Bromage H., Tempst P., Korsmeyer S.J. Proteolytic cleavage of MLL generates a complex of N- and C-terminal fragments that confers protein stability and subnuclear localization. Mol. Cell. Biol. 2003b;23:186–194. - PMC - PubMed
    1. Yokoyama A., Ficara F., Murphy M.J., Meisel C., Naresh A., Kitabayashi I., Cleary M.L. Proteolytically cleaved MLL subunits are susceptible to distinct degradation pathways. J. Cell Sci. 2011;124:2208–2219. - PMC - PubMed

Publication types

MeSH terms