. 2014 Aug;31(8):2156-69.
doi: 10.1093/molbev/msu167. Epub 2014 May 31.

Studying tumorigenesis through network evolution and somatic mutational perturbations in the cancer interactome

Affiliations

Studying tumorigenesis through network evolution and somatic mutational perturbations in the cancer interactome

Feixiong Cheng et al. Mol Biol Evol. 2014 Aug.

Abstract

Cells govern biological functions through complex biological networks. Perturbations to networks may drive cells to new phenotypic states, for example, tumorigenesis. Identifying how genetic lesions perturb molecular networks is a fundamental challenge. This study used large-scale human interactome data to systematically explore the relationship among network topology, somatic mutation, evolutionary rate, and evolutionary origin of cancer genes. We found the unique network centrality of cancer proteins, which is largely independent of gene essentiality. Cancer genes likely have experienced a lower evolutionary rate and stronger purifying selection than those of noncancer, Mendelian disease, and orphan disease genes. Cancer proteins tend to have ancient histories, likely originated in early metazoan, although they are younger than proteins encoded by Mendelian disease genes, orphan disease genes, and essential genes. We found that the protein evolutionary origin (age) positively correlates with protein connectivity in the human interactome. Furthermore, we investigated the network-attacking perturbations due to somatic mutations identified from 3,268 tumors across 12 cancer types in The Cancer Genome Atlas. We observed a positive correlation between protein connectivity and the number of nonsynonymous somatic mutations, whereas a weaker or insignificant correlation between protein connectivity and the number of synonymous somatic mutations. These observations suggest that somatic mutational network-attacking perturbations to hub genes play an important role in tumor emergence and evolution. Collectively, this work has broad biomedical implications for both basic cancer biology and the development of personalized cancer therapy.

Keywords: TCGA; network evolution; network-attacking perturbation; somatic mutation; tumorigenesis.


Figures

F<sc>ig</sc>. 1.
Fig. 1.
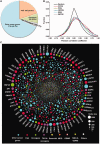
The global cancer protein interactome. (A) Pie chart showing the distribution of oncogenes and TSGs in our curated CCGs. (B) Coexpression correlation of PPI pairs in six networks: the random interaction network, the physical PPIN, the 3DPPIN, the KSIN, the INPPIN, and a large CPPIN. (C) Network representation of the global cancer protein interactome. The annotations of those cancer proteins are labeled in different colors. Node size indicates the node connectivity. The edges are hidden.
F<sc>ig.</sc> 2.
Fig. 2.
Network topological characteristics of three types of disease genes and essential genes. In a subfigure, the left Venn diagram shows the relationship between the essential genes and (A) the CCGs, (B) MDGs, and (C) ODMGs. The right panel shows the odds ratio of hubs versus nonhubs for three sets of proteins distributed in the left Venn diagram in five protein interactomes: (A) Comparison of essential CCG proteins, nonessential CCG proteins, and non-CCG essential proteins (labeled Essential); (B) comparison of essential MDG proteins, nonessential MDG proteins, and non-MDG essential proteins (labeled Essential); (C) comparison of essential ODMG proteins, nonessential ODMG proteins, and non-ODMG essential proteins (labeled Essential). An odds ratio greater than 1 implies that the disease proteins are enriched with hubs in the protein interactome (**P < 0.01). An odds ratio less than 1 implies that the disease proteins are enriched with nonhubs in the protein interactome (e.g., noncancer essential genes [labeled Essential in the figure] are significantly enriched in nonhub proteins in 3DPPIN and KSIN). The data are provided in supplementary tables S6–S10, Supplementary Material online.
F<sc>ig</sc>. 3.
Fig. 3.
Distribution of selective pressure and evolutionary rate of various gene sets. (A) Distribution of the dN/dS ratio for the seven gene sets annotated as CGC, NCG, CG, CCG, MDG, ODMG, and essential genes. (B) Distribution of the evolutionary rate ratio. (C) Proportion of genes with a low dN/dS ratio (<0.1, solid bars) and with a high dN/dS ratio (≥0.1, striped bars). The P values were calculated by Fisher’s exact test. In (D) and (E), the box plots showing the distribution of the dN/dS ratio (D) and the evolutionary rate ratio (E) for noncancer genes, CGC, and CCG. The P values were calculated by the Wilcoxon test.
F<sc>ig</sc>. 4.
Fig. 4.
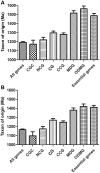
Histogram of average evolutionary ages estimated using the phylogenetic approach for various protein sets. (A) The protein origins (Ma) were calculated using the OrthoMCL clustering approach. (B) The protein origins (ages) were estimated using the Jaccard clustering approach. Error bars represent the standard error of the mean.
F<sc>ig</sc>. 5.
Fig. 5.
Positive correlation of the protein connectivity with their protein origins. Three different PPINs were examined: The physical PPIN, the 3DPPIN, and the CPPIN. In (A), (C), and (E), the protein origins (Ma) were calculated using the Jaccard clustering approach. In (B), (D), and (F), the protein origins were calculated using the OrthoMCL clustering approach. Error bars represent the standard error of the mean. The other two networks (the KSIN and the INPPIN) are shown in supplementary fig. S4, Supplementary Material online.
F<sc>ig</sc>. 6.
Fig. 6.
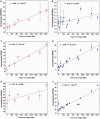
Correlation of two features: Protein connectivity and average gene coexpression coefficient with their number of nonsynonymous somatic mutations. (A and B) Positive correlation of protein connectivity in PPIN with the number of nonsynonymous somatic mutations (TCGA and COSMIC). (C and D) Negative correlation of the gene avePCC with the number of nonsynonymous somatic mutations (TCGA and COSMIC). We grouped data into bins based on the protein ages calculated using the OrthoMCL clustering method, and used these binned data for the linear regression fit analyses. The red error bars denote the standard error of the mean (SEM) for the number of nonsynonymous somatic mutations. The blue error bars denote the SEM for the protein connectivity. The green error bars denote the SEM for the gene avePCC. The data are provided in supplementary tables S14 and S15, Supplementary Material online. The linear regression fit analyses using the unbinned data are provided in supplementary fig. S8, Supplementary Material online.

References

    1. Altenhoff AM, Schneider A, Gonnet GH, Dessimoz C. OMA 2011: orthology inference among 1000 complete genomes. Nucleic Acids Res. 2011;39:D289–D294. - PMC - PubMed
    1. Aparicio S, Caldas C. The implications of clonal genome evolution for cancer medicine. N Engl J Med. 2013;368:842–851. - PubMed
    1. Bashan A, Bartsch RP, Kantelhardt JW, Havlin S, Ivanov P. Network physiology reveals relations between network topology and physiological function. Nat Commun. 2012;3:702. - PMC - PubMed
    1. Benita Y, Cao Z, Giallourakis C, Li C, Gardet A, Xavier RJ. Gene enrichment profiles reveal T-cell development, differentiation, and lineage-specific transcription factors including ZBTB25 as a novel NF-AT repressor. Blood. 2010;115:5376–5384. - PMC - PubMed
    1. Bezginov A, Clark GW, Charlebois RL, Dar VU, Tillier ER. Coevolution reveals a network of human proteins originating with multicellularity. Mol Biol Evol. 2013;30:332–346. - PMC - PubMed

Publication types

LinkOut - more resources