. 2014 Jun 18;82(6):1245-54.
doi: 10.1016/j.neuron.2014.04.041. Epub 2014 May 29.

Multipoint-emitting optical fibers for spatially addressable in vivo optogenetics

Affiliations

Multipoint-emitting optical fibers for spatially addressable in vivo optogenetics

Ferruccio Pisanello et al. Neuron. .

Abstract

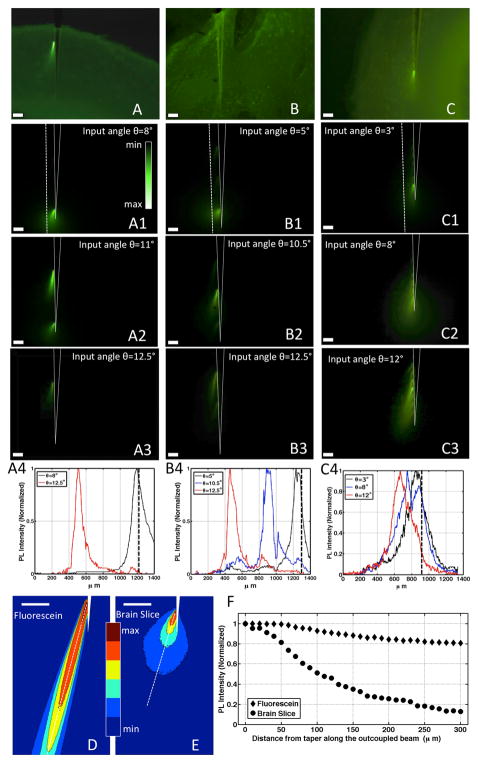
Optical stimulation and silencing of neural activity is a powerful technique for elucidating the structure and function of neural circuitry. In most in vivo optogenetic experiments, light is delivered into the brain through a single optical fiber. However, this approach limits illumination to a fixed volume of the brain. Here a focused ion beam is used to pattern multiple light windows on a tapered optical fiber. We show that such fibers allow selective and dynamic illumination of different brain regions along the taper. Site selection is achieved by a simple coupling strategy at the fiber input, and the use of a single tapered waveguide minimizes the implant invasiveness. We demonstrate the effectiveness of this approach for multipoint optical stimulation in the mammalian brain in vivo by coupling the fiber to a microelectrode array and performing simultaneous extracellular recording and stimulation at multiple sites in the mouse striatum and cerebral cortex.


Figures

Figure 1
Figure 1. Multi-point emitting optical fibers
(A) Schematic representation of a seven-window multi-point emitting optical fiber device. (B-D) SEM micrograph of the realized devices. The inset in panel B shows the circular aperture at the taper tip. The inset in panel C shows the smallest optical window realized in the case of a three-window multi-point emitting optical fiber. (E-F) A square (panel E) and circular (panel F) optical window realized on the taper edge.
Figure 2
Figure 2. Modal evolution in multi-point emitting optical fibers
(A) kjT(d) evolution as a function of the taper diameter d. Each color represents a different value of kjT(d0) at the taper entrance. The dashed black line represents the kj value into the taper. For kjT>kj, the j-th mode becomes evanescent and lies within the grey area. (B) kT of the most powerful mode injected in the core/cladding section of the optical fiber, as a function of the input coupling angle θ. Details on the calculations reported in are given in Supplemental Information.
Figure 3
Figure 3. Optical properties of the multi-point emitting optical fiber in fluorescein solution
(A) Optical setup used to modify the input-coupling angle θ. A CW λ0=473nm laser beam is reflected by a fixed mirror (M1) and a sliding mirror (M2) redirects it toward lens L1. When M2 is in the Home position, the laser beam travels perpendicularly to L1 and through its center, and is then focused onto the optical fiber. When M2 is moved by Pm2 along the optical axis of the setup, the laser beam is still perpendicular to L1 but it is focused into the optical fiber with an angle θ. To perform optical characterization of the device, the fiber taper was immersed in a fluorescein bath and the fluorescein emission collected by an optical microscope equipped with a FITC filter and a color CCD camera. (B-D) Light-microscope images of the 2-, 3- and 7- window devices immersed in a drop of Fluorescein:water solution with no laser coupled at its entrance. (B1-B3,C1-C3,D1-D3): Fluorescence images showing the taper emission for three different input-coupling angles. Scale bars are 100μm. Continuous white lines were added to highlight the taper profile. Dashed lines identify where the intensity profiles in panels B4, C4 and D4 were measured. (B4,C4,D4) Intensity profiles collected 100μm from the fiber taper, along the white dashed lines displayed in panels B1, C1 and D1. (B5,C5,D5) Output angle as a function of the input coupling angle θ for 2-, 3- and 7- window MPF, respectively. Output angle is defined in panel B2.
Figure 4
Figure 4. Optical properties of the multi-point emitting optical fiber in fluorescein-stained coronal brain slices
(A-C) Light-microscope images of the 2-, 3- and 7- window devices inserted in fluorescein-stained mouse brain slices. (A1-A3,B1-B3,C1-C3) Fluorescence images showing the taper emission in fluorescein-stained mouse brain slices for three different input-coupling angles. Scale bars are 100μm. Continuous white lines were added to highlight the taper profile. Dashed lines identify where the intensity profiles in panels A4, B4 and C4 were measured. (A4,B4,C4) Intensity profiles collected 100μm from the fiber taper; black dashed line identify the position of taper tip. (D,E) Iso-intensity photoluminescence curves for a single optical window emitting in Fluorescein:water solution (panel D) and in fluorescein-stained brain slices (panel E). Scale bars are 100μm. Dashed lines identify where the intensity profiles in panel F were measured. (F) Photoluminescence intensity decay comparison in Fluorescein:water solution and brain tissue for windows H1 measured along the white dashed lines in panels D and E, respectively.
Figure 5
Figure 5. Two-color emission and proof-of-principle for use of MPFs with freely behaving animals
(A) Optical setup used to couple two different light beams into the optical fiber, with input coupling angles θB and θY for blue and yellow lasers, respectively (B) Fluorescence image of a 2-MPF immersed in a Fluorescein:TexasRed:water solution for θB∼8° and θY∼12.5°. The blue light excites only fluorescein, which emits at green wavelengths. The yellow light excites only TexasRed, emitting in the red. (C) Fluorescence image of a 2-MPF immersed in a Fluorescein:TexasRed:water solution for θB∼12.5° and θY∼12.5°. The superposition between green fluorescein luminescence and red TexasRed luminescence resulted in brown color at the CCD camera. (D) Schematic representation of the setup used to test MPF with warped fiber and extension cords. (E-H) Fluorescence images showing the taper emission for the configuration represented in panel D before (panels E and F) and after (panels G and H) warping the fiber, at two different θ. The fiber was rolled twice with a curvature radius of 4.5cm. Scale bars are 100μm. Continuous white lines were added to highlight the taper profile. Dashed line in panel E identify where the intensity profiles in panel I were measured. (I) Intensity profiles before (black) and after (red) warping the fiber measured along the white dashed line in panel E.
Figure 6
Figure 6. In vivo use of MPFs
(A) Light-microscope image of the structured optical fiber fixed beside a linear array of electrodes designed for extracellular recording. Optical windows on the tapered fiber were oriented to shine light in the region just above the recording pads. (B) Overlay of sample spikes recorded at Ch2 with θ=3°. Blue curves are 1641 spikes recorded during light ON periods, while black lines are 146 spontaneous spikes recorded during light OFF periods. (C) In vivo recordings in striatum using a 7-MPF. (D) Schematic representation of the in vivo experiment carried out in motor cortex. (E) Representative spiking rate histograms recorded from single units when light was switched from OFF to H1 and from OFF to H2. (F) Summary of the units recorded during in vivo experiments in motor cortex and their sensitivity to light outcolupled form H1 and/or H2.

References

    1. Abaya T, Blair S, Tathireddy P, Rieth L, Solzbacher F. A 3D glass optrode array for optical neural stimulation. Biomed Opt Express. 2012a;3:3087–3104. - PMC - PubMed
    1. Abaya TVF, Diwekar M, Blair S, Tathireddy P, Rieth L, Clark GA, Solzbacher F. Characterization of a 3D optrode array for infrared neural stimulation. Biomed Opt Express. 2012b;3:2200–2219. - PMC - PubMed
    1. Adesnik H, Bruns W, Taniguchi H, Huang ZJ, Scanziani M. A neural circuit for spatial summation in visual cortex. Nature. 2012;490:226–231. - PMC - PubMed
    1. Alivisatos AP, Andrews AM, Boyden ES, Chun M, Church GM, Deisseroth K, Donoghue JP, Fraser SE, Lippincott-Schwartz J, Looger LL, et al. Nanotools for Neuroscience and Brain Activity Mapping. ACS Nano. 2013;7:1850–1866. - PMC - PubMed
    1. Andrasfalvy BK, Zemelman BV, Tang J, Vaziri A. Two-photon single-cell optogenetic control of neuronal activity by sculpted light. Proceedings of the National Academy of Sciences. 2010;107:11981–11986. - PMC - PubMed

Publication types