. 2014 Jun 12;7(5):1495-1508.
doi: 10.1016/j.celrep.2014.05.002. Epub 2014 May 29.

Widespread changes in the posttranscriptional landscape at the Drosophila oocyte-to-embryo transition

Affiliations

Widespread changes in the posttranscriptional landscape at the Drosophila oocyte-to-embryo transition

Iva Kronja et al. Cell Rep. .

Abstract

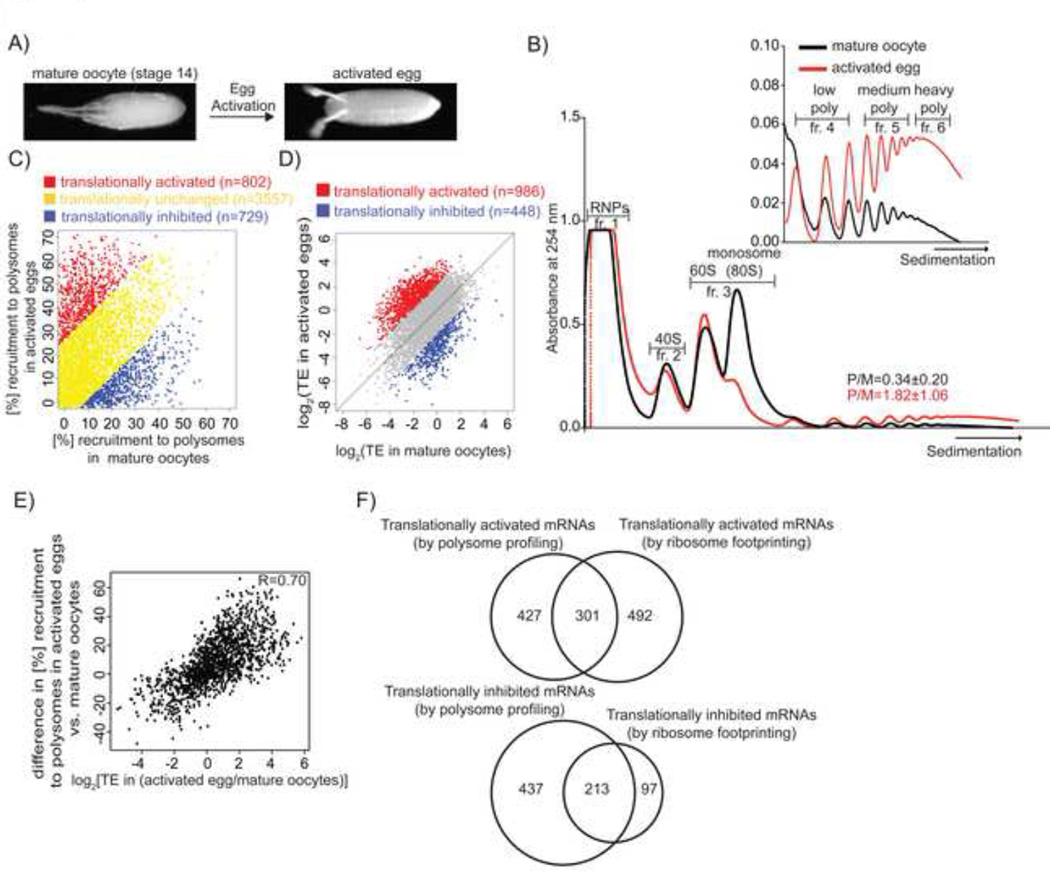
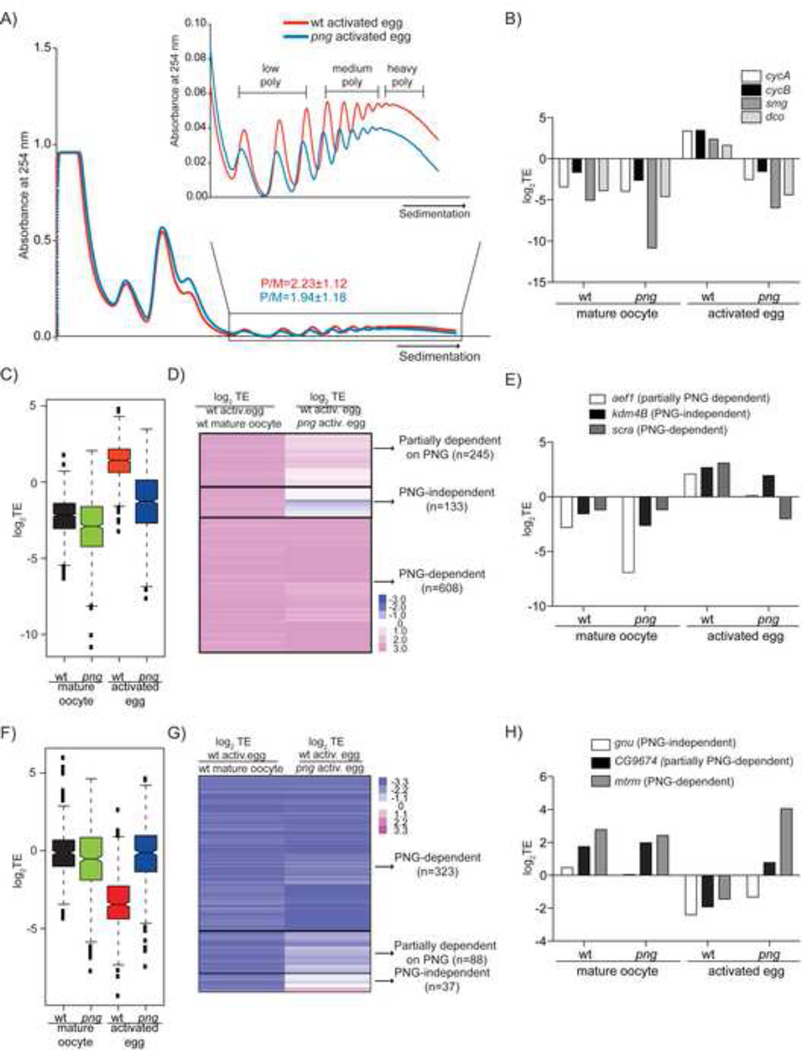
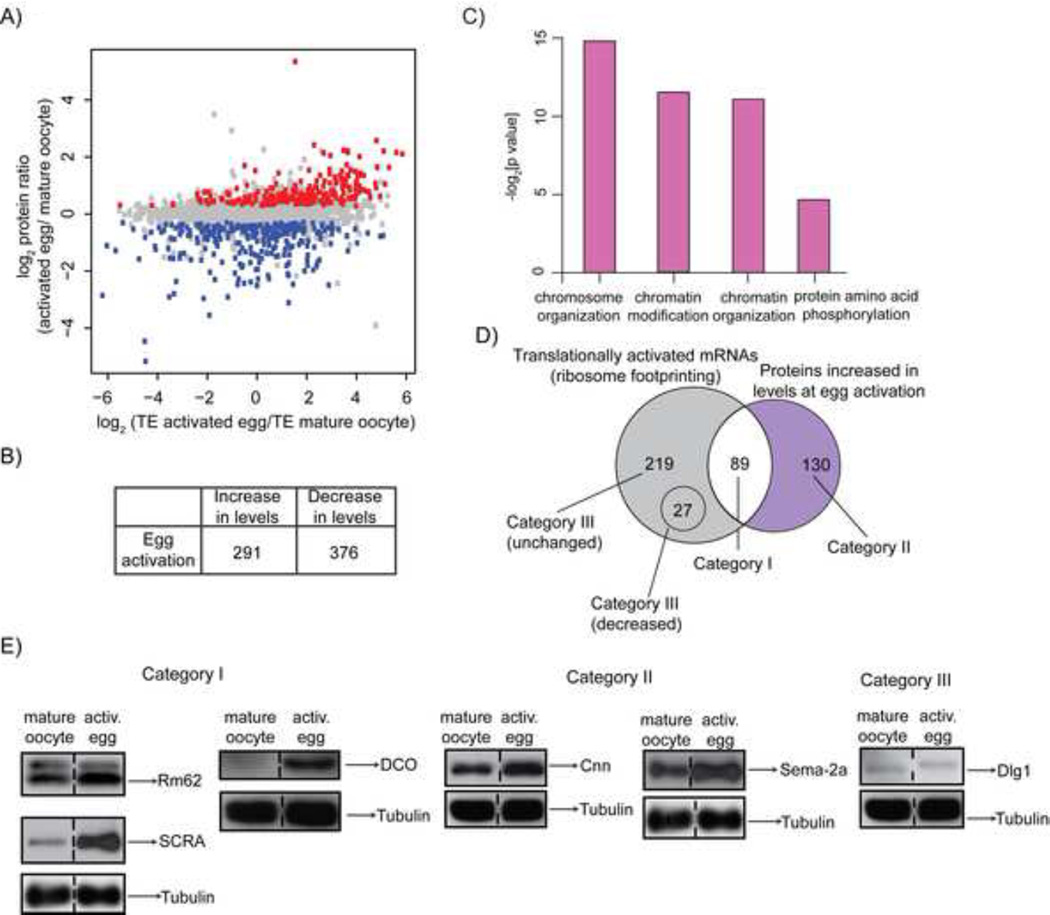
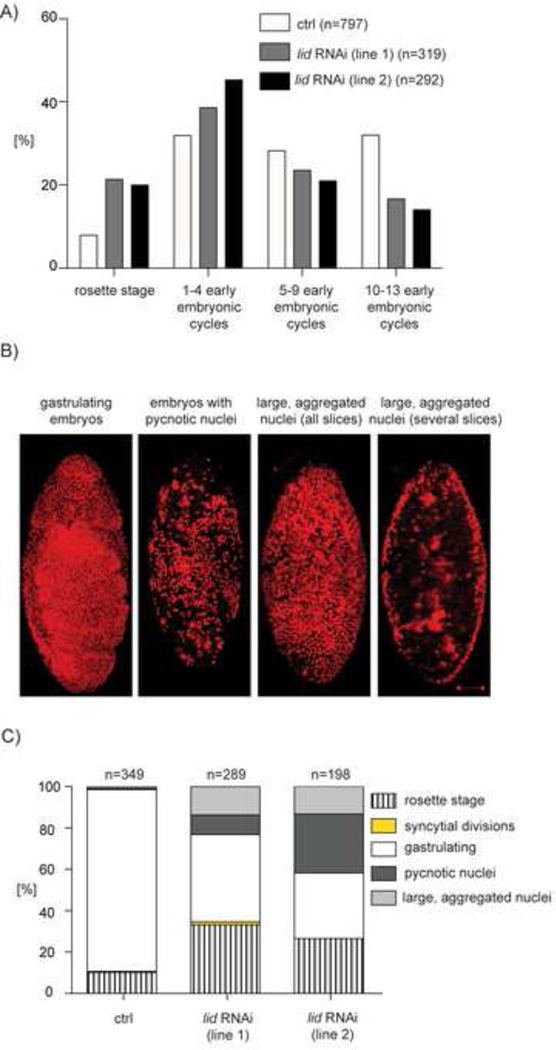
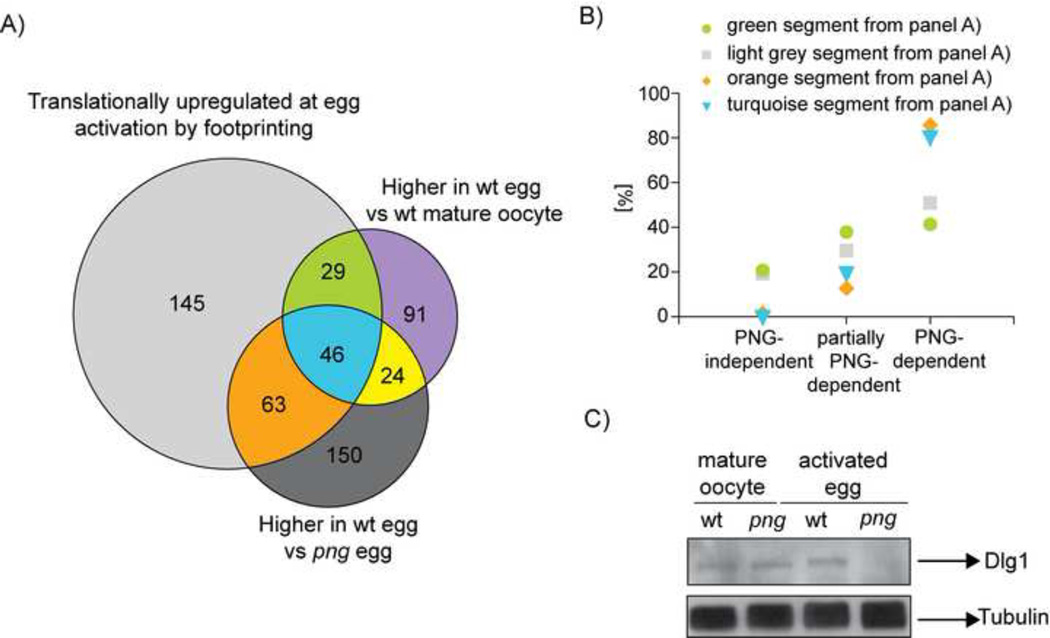
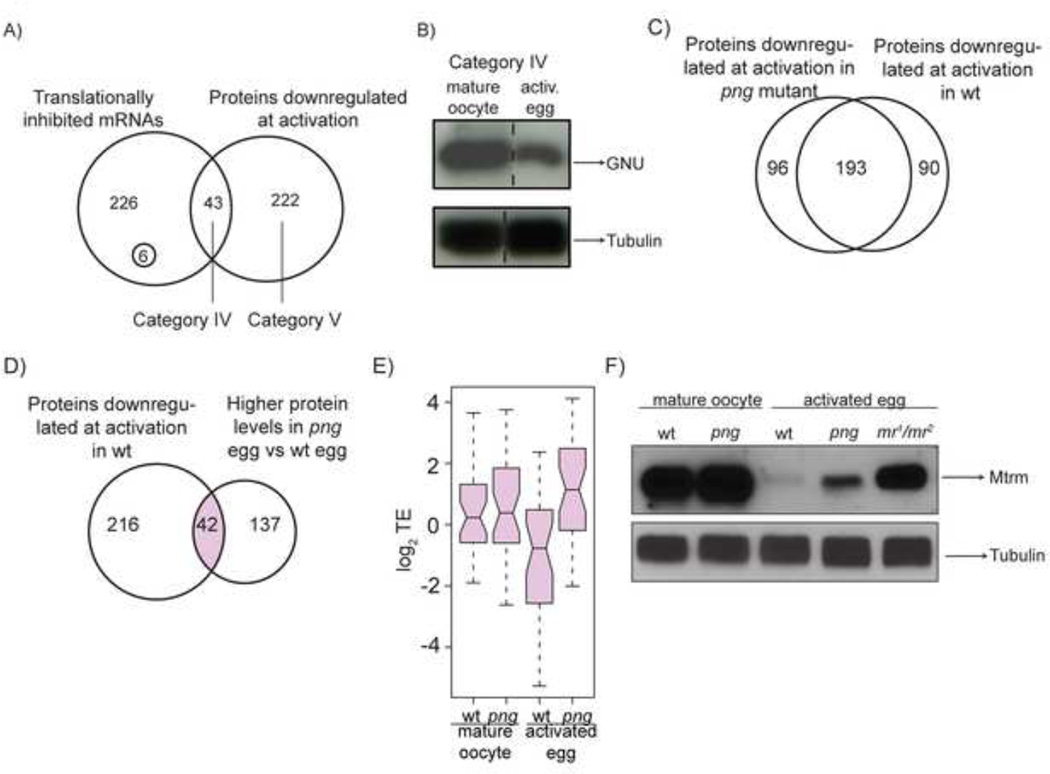
The oocyte-to-embryo transition marks the onset of development. The initial phase of this profound change from the differentiated oocyte to the totipotent embryo occurs in the absence of both transcription and mRNA degradation. Here we combine global polysome profiling, ribosome-footprint profiling, and quantitative mass spectrometry in a comprehensive approach to delineate the translational and proteomic changes that occur during this important transition in Drosophila. Our results show that PNG kinase is a critical regulator of the extensive changes in the translatome, acting uniquely at this developmental window. Analysis of the proteome in png mutants provided insights into the contributions of translation to changes in protein levels, revealing a compensatory dynamic between translation and protein turnover during proteome remodeling at the return to totipotency. The proteome changes additionally suggested regulators of meiosis and early embryogenesis, including the conserved H3K4 demethylase LID, which we demonstrated is required during this period despite transcriptional inactivity.


Figures

Figure 1
Figure 1. Translational changes at egg activation
A) A micrograph of a mature, stage 14 oocyte (pre-activation state) and an activated egg (post-activation state). Anterior is on the left and dorsal is up. B) A representative profile of 254nm absorbance for wild-type mature oocytes (black) and wild-type activated eggs (red). The inset is an enlargement of the polysomal section of the profile (starting from disomes). The six gradient fractions that were sequenced are labeled. Low polysomes correspond to 2–4 ribosomes, medium 5–9 and heavy 10 and higher. Polysome/monosome ratios (P/M) averaged from three biological replicate experiments are represented as mean ± SD. C) Comparison of mRNAs associated with polysomes (n≥5 ribosomes) in mature oocytes and activated eggs. Data were corrected for the presence of mRNAs in the same regions of the gradient after fractionation of puromycin-treated samples. mRNAs were categorized as translationally inhibited (blue) if they had at least 9.1% higher polysomal recruitment in mature oocytes than activated eggs. Translationally activated (red) mRNAshad at least 26.4% higher polysomal recruitment inactivated eggs than mature oocytes. The cutoffs werechosen because they are 1SD from the mean differencefor all the identified mRNAs. The remaining, translationally unchanged, mRNAs are shown in yellow. 5088 mRNAs are represented as the mean of two biological replicates. D) Translational efficiencies (TE, where TE = rpkm ofribosome protected fragments/rpkm for mRNAabundance) in mature oocytes and activated eggs for5842 mRNAs. 986 translationally activated mRNAs (red)have ~4.3 fold higher TE (1SD above the median ratio forall identified mRNAs in both replicates) in activated eggsthan mature oocytes, whereas for 448 translationallyinhibited mRNAs (blue) the TE ratio is ~4.3 fold lower inboth replicates. The mean of two biological replicates isshown. E) Correspondence between the two complimentarymethods to measure the translational status of mRNAs inactivated eggs versus mature oocytes. 4580 mRNAs,detected by both approaches, are shown as the average of two biological replicates for both experiments. The Spearman R value is indicated. F) Upper Venn diagram compares the number of mRNAs identified by polysome profiling (left) or ribosome footprinting (right) as translationally upregulated at egg activation, applying the criteria described in Figures 1C and 1D, respectively. Lower Venn diagram presents translationally inhibited mRNAs. Here, and for all the other Venn diagrams, only factors identified by both approaches (or in all compared samples) are represented.
Figure 2
Figure 2. PNG kinase regulates the translational status of the majority of mRNAs at egg activation
A) A representative profile of 254nm absorbance for wild-type (red) and png activated eggs (blue) as in Fig. 1B, except the polysome/monosome ratios are from two independent experiments. B) Graph showing the TE of four mRNAs translationally upregulated at egg activation in wild-type (wt) but not in png mutants (png). C) Box plot showing TE in wild-type mature oocytes (black), png mature oocytes (green), wild-type (red) and png activated eggs (blue) for 986 mRNAs translationally upregulated at wild-type egg activation. The black lines within each box indicate the median, the edges of the boxes show the first and third quartiles of the values, and whiskers extend to the minimum and maximum values. The average of two replicates is shown. D) Heatmap for 986 translationally activated mRNAscompares the TE ratios of wild-type activated eggsversus mature oocytes with the ratios of wild-type versus png activated eggs. Three classes defining dependenceon PNG for translational activation at egg activationemerged (n=number of mRNAs in each category).TE=mean of two biological replicates. E) TE, in wild-type and png mature oocytes as well asactivated eggs, of three mRNAs representative of thethree groups described in D). F) and G) Same as in C) and D), except 448 translationally inhibited mRNAs are shown. H) Same as in E) except three mRNAs representative of the three groups classifying dependence on PNG for translational repression at egg activation are shown.
Figure 3
Figure 3. Protein remodeling during the oocyte-to-embryo transition
A) Changes in protein levels and translational efficiency at egg activation. Scatterplot of ratio of protein levels in activated eggs versus mature oocytes (mean of three biological replicates) and TE (mean of two biological replicates). The proteins scored as upregulated are shown in red and those downregulated are in blue. 2934 data points are presented (identified both by quantitative mass spectrometry and ribosome fooprinting). B) Table summarizing number of proteins that increase or decrease in levels during egg activation. C) Gene Ontology (GO) term categories (FDR p-value < 0.05) for proteins more abundant in activated eggs than mature oocytes. D) Venn diagram comparing the number of translationally activated mRNAs (Figure 1D) that encode proteins upregulated at egg activation (Category I). Proteins whose levels increase at egg activation according to quantitative mass spectrometry are show in Category II (violet). mRNAs identified by ribosome footprinting as translationally upregulated at egg activation but encoding proteins with unchanged or decreased levels at egg activation are Category III (grey). Only factors identified by both approaches are represented. E) Western blot validation of candidates belonging to the categories described in D). Rm62, SCRA (same membrane reprobed) and DCO are validation examples for Category I; Cnn and Sema-2a (reprobed on Rm62/SCRA membrane) for Category II; and Dlg1 (reprobed on Cnn membrane) is representative of Category III. In this and all subsequent Western blots tubulin was used as a loading control. Dashed line marks that one lane from the original blot is not shown.
Figure 4
Figure 4. The histone H3K4 demethylase lid is required for proper early embryonic development
A) Quantification of the percentage of 0–2h embryos present in different cycles of embryogenesis after the completion of meiosis (as shown in Figure S5D). Embryos were laid either by mothers with only the maternal-tubulin-Gal4 driver (control) or by mothers in which a lid RNAi line was expressed using the mata-tubulin-Gal4 driver. lid RNAi line 1 is BL35706; line 2 is BL36652. One representative experiment is shown. n=the number of embryos scored. B) Representative images of 0–2h embryos that were aged for an additional three hours and stained with a DNA stain (propidium iodide, red). Gastrulating embryos (control) and embryos with pycnotic or aggregated nuclei laid by mothers expressing lid RNAi. Shown are maximal intensity projections of Z-stacks. For embryos with large, aggregated nuclei, shown are the maximal intensity projections of the entire embryo as well as the optical sections in which aggregated nuclei are particularly visible. In all panels the dorsal side of the embryo is shown with anterior at the top. Scale bar is 50 µm. C) Percentage of properly developed (gastrulating) and aberrantly developed 0–2h embryos after three hours of aging. Aberrantly developed embryos were classified as: still at the rosette stage, in syncytial divisions, gastrulating, or displaying pycnotic or aggregated nuclei (as shown in B). The same genotypes as in A) were examined. n=the number of embryos scored.
Figure 5
Figure 5. The translational regulator PNG reveals the importance of translational regulation for homeostasis of protein levels for a subset of proteins at egg activation
A) Same as Figure 3D, except that the comparison included the proteins whose levels are higher in wild-type than png activated eggs according to mass spectrometry. Only factors identified in all compared samples are represented. The translationally upregulated mRNAs are from wild type. B) Percentage of mRNAs encoding proteins belonging to the light grey, orange, green or turquoise segments in panel A that are independent, partially dependent, or dependent on PNG for translational upregulation at egg activation. C) Western blot validation of Dlg1, a candidate from the orange segment of Venn diagram in panel A. Dlg1 levels do not change at egg activation in wild type, although the protein shows altered mobility. In contrast, protein levels are decreased following activation of png mutants (reprobed on the same membrane as in Figure 6F).
Figure 6
Figure 6. Absence of translational shut down at egg activation may interfere with efficient downregulation of a subset of proteins
A) Venn diagram showing the number of translationally inhibited mRNAs (Figure 1D) that encode proteins downregulated at egg activation (Category IV). Otherproteins whose levels decrease at egg activationaccording to quantitative mass spectrometry are inCategory V. Among translationally inhibited mRNAs there are two groups: the majority of mRNAs encode proteins with unchanged levels at egg activation, whereas only six encode proteins whose levels increase. Only factors identified in both samples are represented. B) Western blot validation of GNU, a protein from Category IV. C) And D) Venn diagrams comparing the number of proteins that according to mass spectrometry are downregulated at egg activation in wild-type or png activated eggs (C) or downregulated at activation in wild-type but more abundant in png activated eggs than wild-type (D). Only factors identified in both compared samples are represented. E) Box plot showing translational efficiencies of mRNAsencoding for 36 proteins in the overlap zone (shown inlight pink) of Venn diagram in panel D. 36 out of 42mRNAs are presented because the other 6 were notidentified by ribosome footprinting. F) Western blot comparing Mtrm levels at egg activation in wild-type and png mutant background as well as in the activated eggs laid by mothers transheterozygous for female-sterile alleles of the APC2 subunit of APC/C, morula (mr1/mr2). In png mutants in which translational inhibition of mtrm does not occur, Mtrm protein levels are elevated, although to a lesser extent than when the APC/C is mutated.

References

    1. Anderson KV, Lengyel JA. Rates of synthesis of major classes of RNA in Drosophila embryos. Dev Biol. 1979;70:217–231. - PubMed
    1. Beilharz TH, Preiss T. Translational profiling: the genome-wide measure of the nascent proteome. Brief Funct Genomic Proteomic. 2004;3:103–111. - PubMed
    1. Blobel G, Sabatini D. Dissociation of mammalian polyribosomes into subunits by puromycin. Proc Natl Acad Sci USA. 1971;68:390–394. - PMC - PubMed
    1. Boersema PJ, Raijmakers R, Lemeer S, Mohammed S, Heck AJ. Multiplex peptide stable isotope dimethyl labeling for quantitative proteomics. Nat Protoc. 2009;4:484–494. - PubMed
    1. Brar GA, Yassour M, Friedman N, Regev A, Ingolia NT, Weissman JS. High-resolution view of the yeast meiotic program revealed by ribosome profiling. Science. 2012;335:552–557. - PMC - PubMed

Publication types

MeSH terms

Associated data