. 2014 Jun 11;15(6):779-91.
doi: 10.1016/j.chom.2014.05.004. Epub 2014 May 29.

Infection mobilizes hematopoietic stem cells through cooperative NOD-like receptor and Toll-like receptor signaling

Affiliations

Infection mobilizes hematopoietic stem cells through cooperative NOD-like receptor and Toll-like receptor signaling

Aaron Burberry et al. Cell Host Microbe. .

Abstract

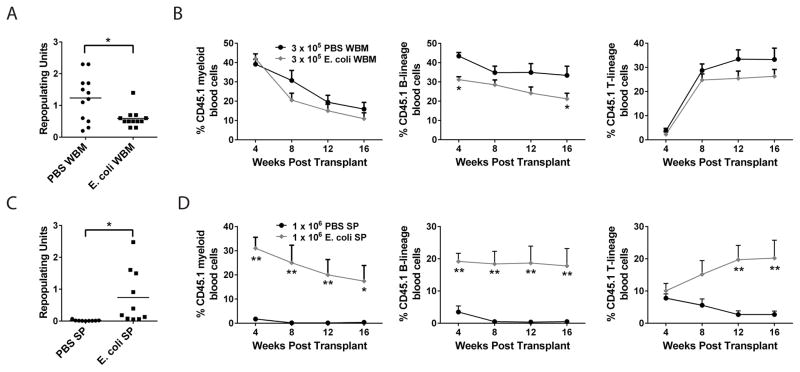
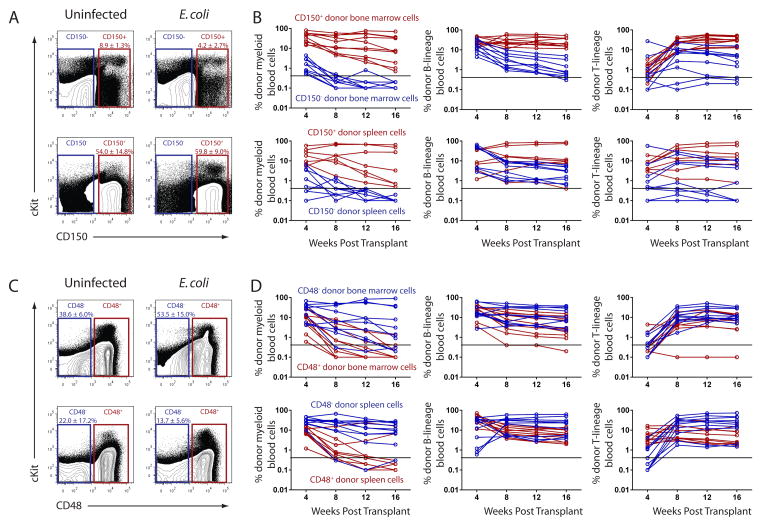
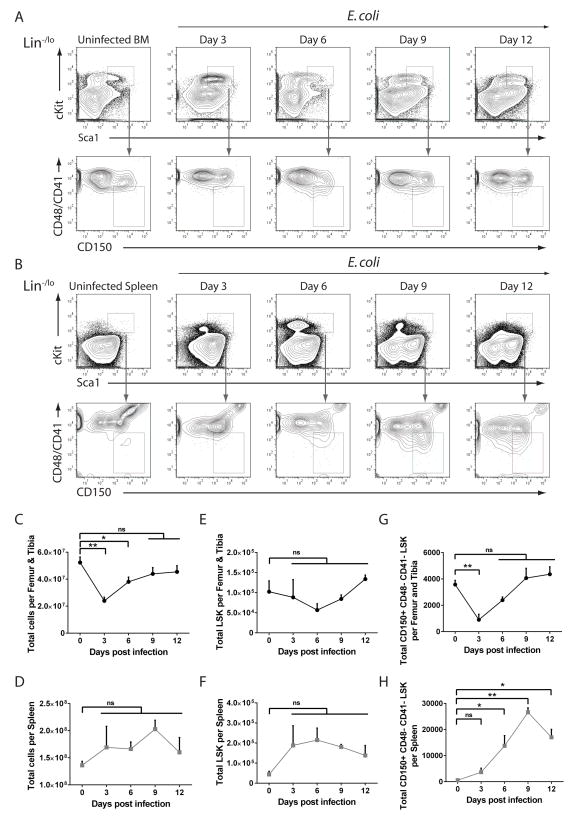
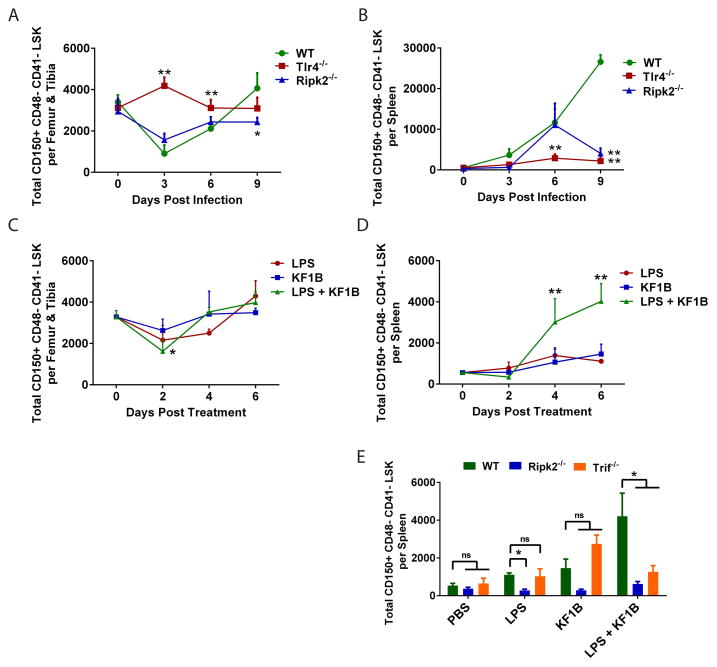
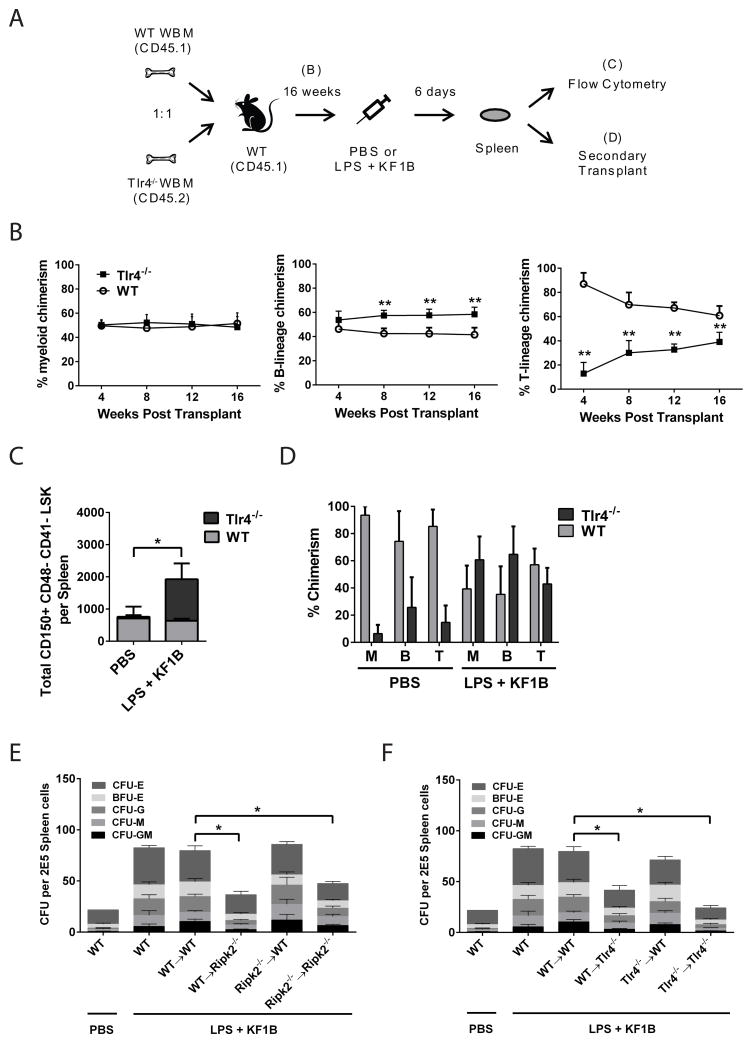
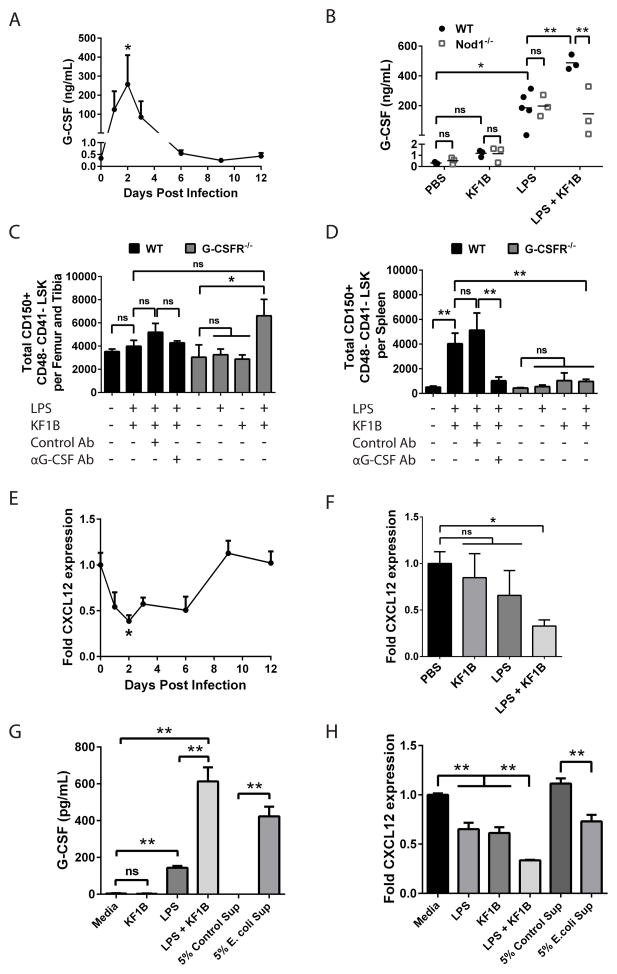
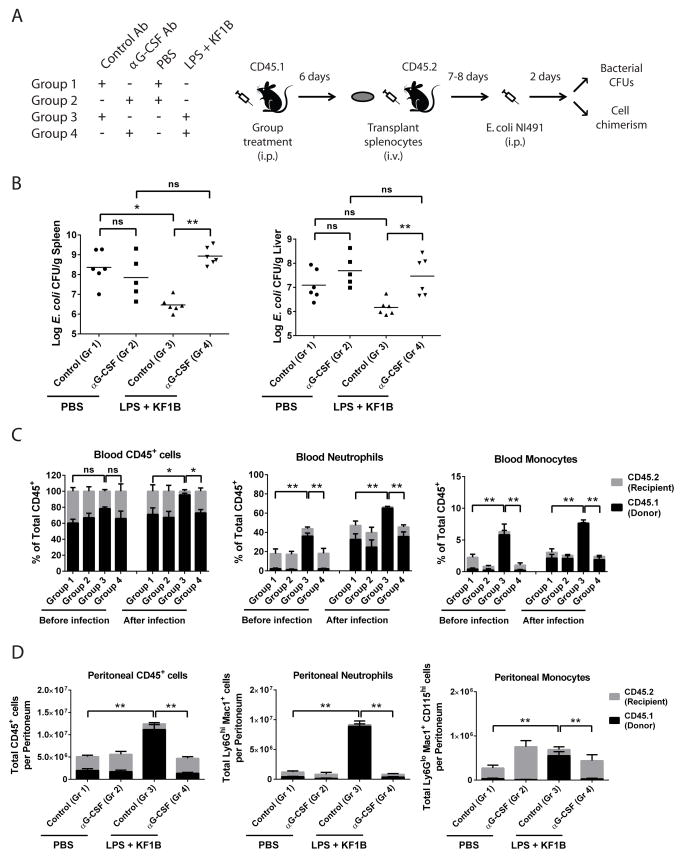
Adult hematopoietic stem cells (HSCs) are maintained in specialized niches within the bone marrow under steady-state conditions and mobilize for extramedullary hematopoiesis during periods of stress such as bacterial infections. However, the underlying mechanisms are unclear. We show that systemic infection of mice with Escherichia coli, commonly associated with bacteremia in humans, mobilizes functional HSCs to the spleen. Accumulation of splenic HSCs (CD150+CD48-Lin(-/low)Sca1+cKit+) was diminished in TLR4-deficient and RIPK2-deficient mice, implicating TLRs and cytosolic NOD1/NOD2 signaling in the process. Accordingly, dual stimulation of NOD1 and TLR4 in radio-resistant cells alone was sufficient to mobilize HSCs, while TLR4 expression on HSCs was dispensable. Mechanistically, TLR4 and NOD1 synergistically induced granulocyte colony-stimulating factor (G-CSF), which was required for extramedullary HSC accumulation. Mobilized HSCs and progenitor cells gave rise to neutrophils and monocytes and contributed to limiting secondary infection.


Figures

Figure 1
Figure 1. Infection reduces HSC activity in bone marrow and increases HSC activity in spleen
(A–D) WT mice were injected with ~1x10⁸ E. coli K12 i.p. and after six days (A, B) 3x10⁵ whole bone marrow (WBM) or (C, D) 1x10⁶ splenocytes were mixed with 3x10⁵ WBM and transplanted into lethally irradiated recipients. Peripheral blood chimerism of myeloid (Mac1+), B-lineage (B220+) and T-lineage (CD3+) cells was analyzed by flow cytometry every 4 weeks. (A, C) n = 12 mice per condition from 2 experiments. *p<0.05 by t-test. (B, D) n= 9–10 mice per condition from two experiments. *p<0.05 **p<0.05 by Two way ANOVA versus recipients of PBS cells at each time point. Error bars represent SEM.
Figure 2
Figure 2. The majority of HSC activity exists in the CD150+ CD48− fraction of bone marrow and spleen during infection
(A–D) WT mice were injected with ~1x10⁸ E. coli K12 i.p. and after six days, (top) bone marrow or (bottom) splenocytes were sorted and resorted based on positive or negative expression of (A, B) CD150 or (C, D) CD48. (B, D) Positive or negative fractions from (top) bone marrow or (bottom) spleen were mixed with 3x10⁵ WBM and transplanted into lethally irradiated recipients. Peripheral blood chimerism of myeloid (Mac1+), B-lineage (B220+) and T-lineage (CD3+) cells was analyzed by flow cytometry. Connected data points represent individual mice bled every 4 weeks. Data are from two experiments for each condition. The black line represents the background threshold of 0.3% below which we could not detect chimerism. See also Figure S1, Figure S2, Table S1 and Table S2.
Figure 3
Figure 3. Kinetics of hematopoietic stem and progenitor cells during systemic E. coli infection
(A–H) WT mice were injected with ~1x10⁸ E. coli K12 i.p. and femur and tibia or spleens were isolated at indicated time points. Shown are representative flow plots from (A) bone marrow or (B) spleen and quantification of (C) total BM cells, (D) total splenocytes, (E) total BM Lineage−/low Sca1+ cKit+ (LSK), (F) total splenic LSK, (G) total BM HSCs (CD150+ CD48− CD41− LSK) and (H) total splenic HSCs. n = 3–8 mice per time point. Error bars indicate SEM. *p<0.05 **p<0.01 by One way ANOVA. (ns) not significant. See also Figure S3 and Figure S4.
Figure 4
Figure 4. Combined signaling of NOD-like Receptors and Toll-like Receptors is important for HSC accumulation in spleen during infection
(A, B) WT, Tlr4−/− or Ripk2−/− mice were infected with ~1x10⁸ E. coli K12 i.p. and WBM or splenocytes were isolated. Total HSCs (CD150+ CD48 CD41 LSK) were enumerated in (A) bone marrow and (B) spleen. n = 3–8 mice per time point. *p<0.05 **p<0.01 by Two way ANOVA versus WT mice at same time point. (C, D) WT mice were injected with PBS, the TLR4 agonist LPS (100 ug), the NOD1 agonist KF1B (50 ug) or both i.p. and HSCs were quantified in (C) bone marrow and (D) spleen at indicated time points. n = 3–6 mice per time point. *p<0.05 **p<0.01 by Two way ANOVA versus PBS treated mice. (E) WT, Ripk2−/− or Trif−/− mice were injected as in C–D and HSCs were quantified in spleen after six days. n = 3–6 mice per condition. **p<0.01 by One way ANOVA. See also Figure S5.
Figure 5
Figure 5. Radio-resistant cells are important for NOD1 and TLR4 induced HSC accumulation in spleen
(A) Schematic of experiments in (B–D). (B) Peripheral blood chimerism mice transplanted with a 1:1 mixture of WT and Tlr4−/− WBM and bled every 4 weeks. n = 7 mice **p<0.01 by Two way ANOVA. (C) After 16 weeks, chimeric mice were injected with PBS or LPS + KF1B and 6 days later, the absolute number of HSCs (CD150+ CD48 CD41 LSK) in spleen was enumerated. n = 3–4 mice per condition. *p<0.05 by One way ANOVA. (D) 3x10⁷ splenocytes from mice in B–C were transplanted non-competitively into lethally irradiated recipients and peripheral blood chimerism measured 16 weeks after transplant. (E, F) Chimeras were generated as described in text. Mice were injected with PBS or LPS + KF1B and after 6 days, splenocytes were plated in Methocult 3434. n = 3–7 mice per condition. *p<0.05 by One way ANOVA. Error bars represent SEM. Burst Forming Unit (BFU) –E (Erythroid); Colony Forming Unit (CFU) –E (Erythroid); –G (Granulocyte); –M (Macrophage); –GM (Granulocyte-Macrophage).
Figure 6
Figure 6. NOD1 and TLR4 induced HSC accumulation in spleen is dependent on G-CSF
(A) G-CSF in sera after i.p. injection of WT mice with ~1 x 10⁸ E. coli. n = 3–7 mice per time point. (B) G-CSF in sera 4 hours after i.p. injection of WT or Nod1−/− mice with KF1B (50 ug), LPS (100 ug) or both. Each data point represents one mouse. (C, D) Quantification of HSCs (CD150+ CD48 CD41 LSK) in (C) bone marrow or (D) spleen 6 days after challenge. Where indicated, WT mice received 250 ug of isotype control or G-CSF-blocking antibody (Ab) i.p. 1 hour before challenge. n = 3–5 mice per condition. (E) CXCL12 expression in WBM following infection of WT mice as in A. (F) CXCL12 expression in WBM 2 days after injection of WT mice as in B. n = 3–5 mice per condition. (G) G-CSF in supernatants from cultured C166 endothelial cells 24 hours after stimulation with KF1B (1 ug/mL), LPS (10 ng/mL), both or E. coli supernatant (Sup). (H) CXCL12 expression in cultured C166 endothelial cells 4 hours after stimulation as in G. Data are representative of at least 3 independent experiments. * p < 0.05 ** p < 0.01 by One-way ANOVA for all graphs. (ns) not significant. Error bars represent SEM.
Figure 7
Figure 7. NOD1 and TLR4 mobilized HSPCs contribute to limiting infection
(A) Schematic of experiments in (B–D). (B) Colony forming units (CFUs) of E. coli NI491 per gram of spleen or liver two days after infection. Each data point represents CFUs from one mouse. (C) Peripheral blood chimerism one day before and two days after infection. Neutrophils were defined as Ly6Ghi Mac1+ and monocytes were defined as CD115+ Mac1+. (D) Total cell numbers and chimerism from peritoneal cavity two days after infection. Black bars represent donor splenocyte derived cells, while grey bars represent residual recipient derived cells. n = 5–6 mice per group combined from two independent experiments. * p < 0.05 ** p < 0.01 by One-way ANOVA for all graphs. Error bars represent SEM.

Comment in

References

    1. Baldridge MT, King KY, Boles NC, Weksberg DC, Goodell MA. Quiescent haematopoietic stem cells are activated by IFN-gamma in response to chronic infection. Nature. 2010;465:793–797. - PMC - PubMed
    1. Casanova-Acebes M, Pitaval C, Weiss LA, Nombela-Arrieta C, Chevre R, NAG, Kunisaki Y, Zhang D, van Rooijen N, Silberstein LE, et al. Rhythmic Modulation of the Hematopoietic Niche through Neutrophil Clearance. Cell. 2013;153:1025–1035. - PMC - PubMed
    1. Chen C, Liu Y, Liu Y, Zheng P. Mammalian target of rapamycin activation underlies HSC defects in autoimmune disease and inflammation in mice. The Journal of clinical investigation. 2010;120:4091–4101. - PMC - PubMed
    1. Delano MJ, Kelly-Scumpia KM, Thayer TC, Winfield RD, Scumpia PO, Cuenca AG, Harrington PB, O’Malley KA, Warner E, Gabrilovich S, et al. Neutrophil mobilization from the bone marrow during polymicrobial sepsis is dependent on CXCL12 signaling. J Immunol. 2011;187:911–918. - PMC - PubMed
    1. Ding L, Morrison SJ. Haematopoietic stem cells and early lymphoid progenitors occupy distinct bone marrow niches. Nature. 2013;495:231–235. - PMC - PubMed

Publication types

MeSH terms