Review
. 2014 Jun 1;592(11):2267-81.
doi: 10.1113/jphysiol.2014.272385.

Bioattractors: dynamical systems theory and the evolution of regulatory processes

Affiliations
Review

Bioattractors: dynamical systems theory and the evolution of regulatory processes

Johannes Jaeger et al. J Physiol. .

Abstract

In this paper, we illustrate how dynamical systems theory can provide a unifying conceptual framework for evolution of biological regulatory systems. Our argument is that the genotype-phenotype map can be characterized by the phase portrait of the underlying regulatory process. The features of this portrait--such as attractors with associated basins and their bifurcations--define the regulatory and evolutionary potential of a system. We show how the geometric analysis of phase space connects Waddington's epigenetic landscape to recent computational approaches for the study of robustness and evolvability in network evolution. We discuss how the geometry of phase space determines the probability of possible phenotypic transitions. Finally, we demonstrate how the active, self-organizing role of the environment in phenotypic evolution can be understood in terms of dynamical systems concepts. This approach yields mechanistic explanations that go beyond insights based on the simulation of evolving regulatory networks alone. Its predictions can now be tested by studying specific, experimentally tractable regulatory systems using the tools of modern systems biology. A systematic exploration of such systems will enable us to understand better the nature and origin of the phenotypic variability, which provides the substrate for evolution by natural selection.


Figures

Figure 1
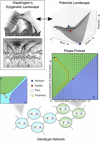
Figure 1. From Waddington's landscape to genotype networks
Top left: the upper panel shows Waddington's most famous illustration of his epigenetic landscape. Developmental trajectories are represented by a ball rolling down the valleys of the landscape. Branch points represent developmental decisions. The lower panel illustrates the influence of the genes, which are drawn as pegs connected to the underside of the landscape by guy ropes. Genes can alter the shape of the landscape by pulling on these ropes. Both illustrations are from Waddington (1957), Strategy of the Genes. At the bottom of the figure we illustrate the concept of a genotype network. Variants of a toggle switch model are represented by network diagrams, where green/blue nodes represent regulatory genes, while arrows indicate activating and T bars repressing regulatory interactions. A genotype network is a (meta-)network of such networks, which are connected by mutational steps (addition, removal or sign reversal of a regulatory interaction). Two genotype networks are shown: one for regulatory networks converging to a state where low levels of the blue and green factors coexist (cyan background), the other for networks converging to a blue off, green on state (green background). Middle panels show two examples of phase portraits corresponding to specific network structures or genotypes in the bottom panel. Axes of these portraits correspond to regulator concentrations (as indicated in the panel on the right). Black arrows represent the flow of the system. Blue circles are attractors, red circles saddle points. Basins of attraction are indicated by blue, green and cyan background respectively. Basin borders correspond to separatrices (black lines). An example trajectory is shown in yellow for both phase portraits. Top right: this panel shows the potential landscape derived from the phase portrait on the right. Attractors, saddles and separatrices are shown as in the phase portraits. The slope of the potential surface is determined by the flow of the system. Attractors lie in local troughs, valleys correspond to unstable manifolds that connect the saddle to the two attractors. The potential surface is a mathematically explicit formulation of Waddington's landscape metaphor. See text for details.
Figure 2
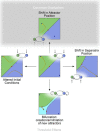
Figure 2. Phase portraits characterize the genotype–phenotype map
Genotype space is shown on the left, example phase portraits of the system in the middle, and the resulting trajectories in phenotype space on the right. A population of individuals with variation in initial conditions (due to the environment) and systems parameters (due to genetic variation) is represented by pentagons. Given a specific genotype and specific environmental conditions, the system will follow a particular trajectory to produce a particular phenotypic outcome. Examples of such trajectories are shown in yellow and magenta in the middle and right-hand panels). The geometry of phase space determines which phenotypic outcomes can be reached. See text for details.
Figure 3
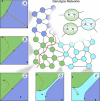
Figure 3. The four types of change in phase space geometry during evolution
Regulatory structures and phase portraits of toggle switch models are shown as in Fig. 1. The original network is shown in the middle. It converges to the green on, blue off attractor at the top left corner of the phase portrait. The four peripheral panels indicate the four possible ways in which phase space can affect evolutionary change. Top, shift in attractor position has occurred due to weakened activating inputs to the two regulators (dashed arrows in network diagram). The system converges to a different state with lower concentrations of the green factor, while its basic on/off behaviour remains unaffected. This corresponds to Darwin's concept of gradual evolution (indicated by the grey background colour). All three other types of change lead to discrete threshold effects. Left, a change in initial condition can either be buffered (as long as it remains in the same basin of attraction) or lead to a sudden and drastic switch to the alternative (blue) attractor state. Right, introducing an asymmetry in repressive strength between the two regulator genes causes the separatrix to shift. As soon as it crosses the position of the initial condition, the system will converge to the alternative (blue) attractor state. Bottom, introduction of autoactivation can lead to the creation of a third attractor state (shown in cyan) by a bifurcation event. If the initial condition comes to lie within the newly created attractor basin, the system will converge to the novel state. Again, this transition is abrupt and discrete. See text for details.
Figure 4
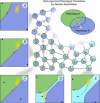
Figure 4. Robustness, innovation and evolvability
This figure illustrates how features of phase space can explain the presence and geometry of large genotype networks, which determine the robustness and evolvability of a regulatory system. It shows three genotype networks, one for each of the tristable attractor states (blue, green and cyan network nodes). Connectors between nodes represent mutational steps. The inset on the top right shows that each node corresponds to a specific genotype or regulatory structure (as in Fig. 1). A–E, phase portraits for selected nodes (axes and layout as in Fig. 1). Individual trajectories given a specific initial condition are shown as yellow arrows. Boundaries of genotype networks correspond to the initial condition crossing a separatrix, thus causing the system to converge to an alternative steady state. The curved red line in the genotype network diagram represents the bifurcation boundary where the cyan attractor state is created/annihilated. Note that it does not coincide with any genotype network boundary. This allows the system to cross a bifurcation boundary by neutral drift, thereby increasing its innovation potential by increasing the number of alternative genotype networks it can encounter in phase space. See text for details.
Figure 5
Figure 5. The role of the environment: genetic assimilation and self-organization
How polyphenism can lead to self-organized evolutionary convergence toward a novel adaptive phenotype through genetic assimilation. The basic layout is the same as Fig. 4. Nodes in genotype networks are now displayed as pie charts reflecting the relative size of the basins of attraction representing each phenotype in the phase portraits (A–E, blue, green and cyan). Multi-stable nodes (which have more than one coloured sector in their pie charts) can belong to different genotype networks depending on initial conditions. Genetic assimilation is modelled using a population of genotypes indicated by yellow clouds in phase portraits A–E. An environmental perturbation triggers the population to express an alternative phenotype (cyan; shift of initial conditions indicated by the grey arrow in D). Selection then causes stabilization of this phenotype by enlargement of its basin (transition from D to E). The novel phenotype is now expressed even in the absence of the environmental trigger (reverse shift of initial conditions represented by the grey arrow in E). Self-organization of phenotypic transitions is shown as follows: grey arrows between pie charts represent fastest evolutionary path from the green to the blue genotype network. This is summarized in the inset on the top right: circles indicate green and blue genotype networks respectively. Maximally increasing penetrance along the mutational path (grey arrow) leads to self-organized transition (evolutionary funnelling) of the population to the alternative (blue) state. See text for details.

References

    1. Alberch P. Developmental constraints in evolutionary processes. In: Bonner JT, editor. Evolution and Development. Heidelberg: Springer; 1982. pp. 313–332.
    1. Alberch P. From genes to phenotype: dynamical systems and evolvability. Genetica. 1991;84:5–11. - PubMed
    1. Arthur W. Biased Embryos and Evolution. Cambridge: Cambridge University Press; 2004.
    1. Bhattacharya S, Zhang Q, Andersen ME. A deterministic map of Waddington's epigenetic landscape for cell fate specification. BMC Syst Biol. 2011;5:85. - PMC - PubMed
    1. Borenstein E, Krakauer DC. An end to endless forms: Epistasis, phenotype distribution bias, and nonuniform evolution. PLoS Comput Biol. 2008;4:e10000202. - PMC - PubMed

Publication types

LinkOut - more resources