

Tongue fat infiltration in obese versus lean Zucker rats
- PMID: 24882904
- PMCID: PMC4015383
- DOI: 10.5665/sleep.3768
Tongue fat infiltration in obese versus lean Zucker rats
Abstract
Study objectives: Obesity is the most important risk factor for obstructive sleep apnea (OSA), and the effects of obesity may be mediated by tongue fat. Our objective was to examine the effects of obesity on upper airway structures in obese (OBZ) and non-obese (NBZ) Zucker rats.
Design: Animal study.
Setting: Academic Medical Center.
Participants: OBZ (638.2 ± 39 g; 14.9 ± 1.1 w) and age-matched NBZ Zucker (442.6 ± 37 g, 15.1 ± 1.5 w) rats.
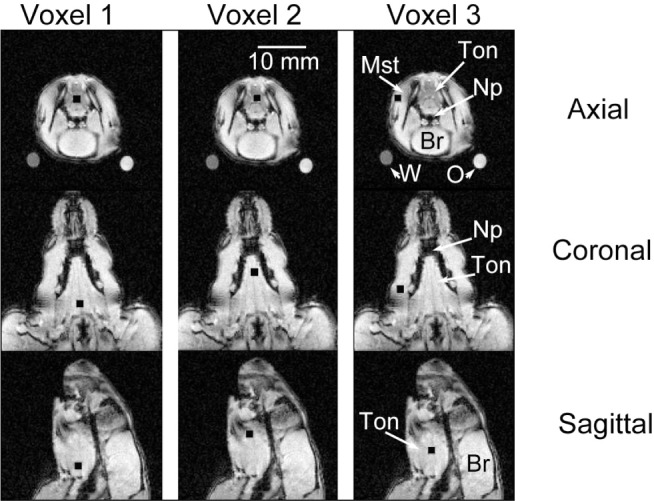
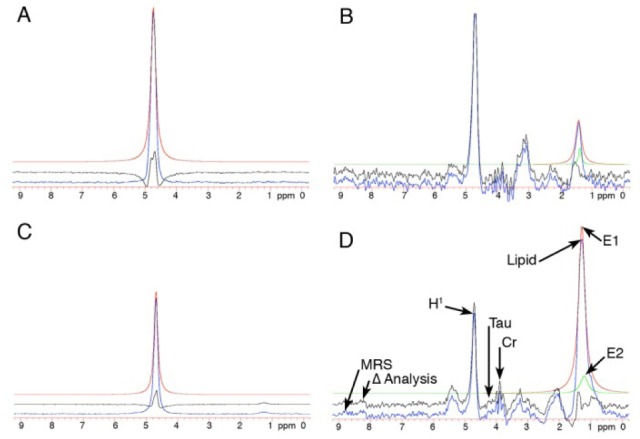
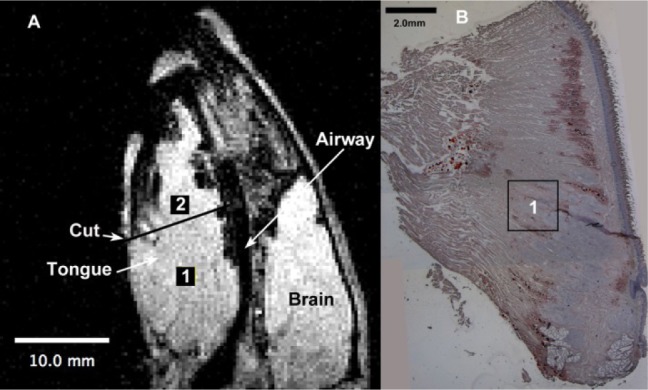
Interventions: TONGUE FAT AND VOLUME AND WERE ASSESSED USING: in vivo magnetic resonance spectroscopy (MRS), magnetic resonance imaging including Dixon imaging for tongue fat volume, ex vivo biochemistry (fat quantification; triglyceride (mg)/tissue (g), and histology (Oil Red O stain).
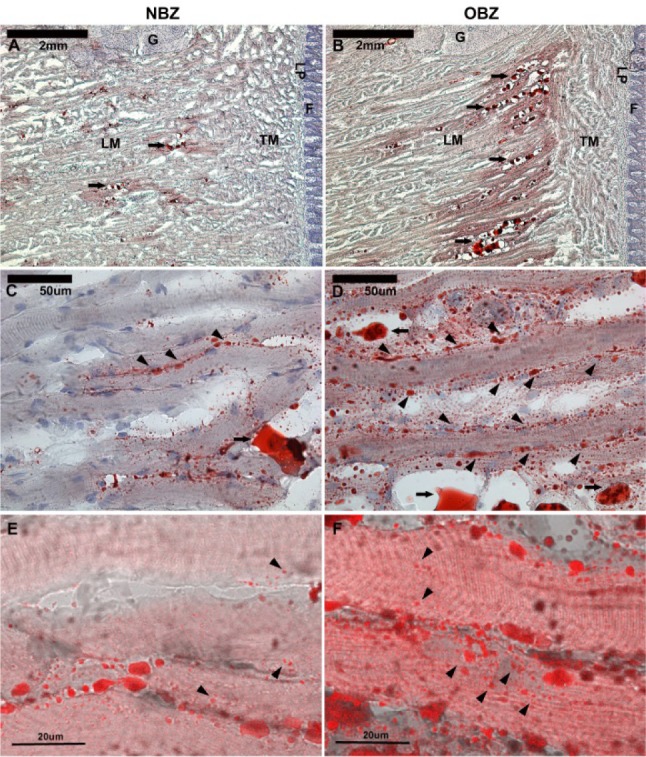
Measurements and results: MRS: overall OBZ tongue fat/water ratio was 2.9 times greater than NBZ (P < 0.002) with the anterior OBZ tongue up to 3.3 times greater than NBZ (P < 0.002). Biochemistry: Triglyceride (TG) in the tongue was 4.4 times greater in OBZ versus NBZ (P < 0.0006). TG was greater in OBZ tongue (3.57 ± 1.7 mg/g) than OBZ masseter muscle (0.28 ± 0.1; P < 0.0001) but tongue and masseter TG were not different in NBZ rats (0.82 ± 0.3 versus 0.28 ± 0.1 mg/g, P = 0.67). Dixon fat volume was significantly increased in OBZ (56 ± 15 mm3) versus NBZ (34 ± 5 mm3, P < 0.004). Histology demonstrated a greater degree of intracellular muscle fat and extramuscular fat infiltration in OBZ versus NBZ rats.
Conclusions: Genetically obese rats had a large degree of fat infiltration in the tongue compared to both skeletal muscle and tongue tissues of the non-obese age-matched littermates. The significant fat increase and sequestration in the obese tongue may play a role in altered tongue neuromuscular function, tongue stiffness or metabolic function.
Keywords: Dixon imaging; MRI; Zucker rats; obesity; obstructive sleep apnea; spectroscopy; tongue; upper airway.
Figures
Comment in
-
Back to basics regarding upper airway obstruction during sleep-size matters.Sleep. 2014 Jun 1;37(6):1031-2. doi: 10.5665/sleep.3752. Sleep. 2014. PMID: 24882896 Free PMC article. No abstract available.
Similar articles
-
Back to basics regarding upper airway obstruction during sleep-size matters.Sleep. 2014 Jun 1;37(6):1031-2. doi: 10.5665/sleep.3752. Sleep. 2014. PMID: 24882896 Free PMC article. No abstract available.
-
Tongue fat and its relationship to obstructive sleep apnea.Sleep. 2014 Oct 1;37(10):1639-48. doi: 10.5665/sleep.4072. Sleep. 2014. PMID: 25197815 Free PMC article.
-
Metabolic activity of the tongue in obstructive sleep apnea. A novel application of FDG positron emission tomography imaging.Am J Respir Crit Care Med. 2014 Jun 1;189(11):1416-25. doi: 10.1164/rccm.201310-1753OC. Am J Respir Crit Care Med. 2014. PMID: 24779734 Free PMC article.
-
Abdominal fat and sleep apnea: the chicken or the egg?Diabetes Care. 2008 Feb;31 Suppl 2(7):S303-9. doi: 10.2337/dc08-s272. Diabetes Care. 2008. PMID: 18227501 Free PMC article. Review.
-
Obesity and upper airway control during sleep.J Appl Physiol (1985). 2010 Feb;108(2):430-5. doi: 10.1152/japplphysiol.00919.2009. Epub 2009 Oct 29. J Appl Physiol (1985). 2010. PMID: 19875707 Free PMC article. Review.
Cited by
-
Obstructive sleep apnea in obese minipigs.J Transl Sci. 2020 Oct;6(5):10.15761/jts.1000374. doi: 10.15761/jts.1000374. Epub 2020 Jan 27. J Transl Sci. 2020. PMID: 33014436 Free PMC article.
-
Neck fat and obstructive sleep apnea in obese adolescents.Sleep. 2021 Nov 12;44(11):zsab158. doi: 10.1093/sleep/zsab158. Sleep. 2021. PMID: 34165571 Free PMC article.
-
Back to basics regarding upper airway obstruction during sleep-size matters.Sleep. 2014 Jun 1;37(6):1031-2. doi: 10.5665/sleep.3752. Sleep. 2014. PMID: 24882896 Free PMC article. No abstract available.
-
[Application of Animal Models in Research on Hypoxia-Related Diseases].Sichuan Da Xue Xue Bao Yi Xue Ban. 2025 Mar 20;56(2):331-338. doi: 10.12182/20250360101. Sichuan Da Xue Xue Bao Yi Xue Ban. 2025. PMID: 40599265 Free PMC article. Review. Chinese.
-
Effect of Obesity on Masticatory Muscle Activity and Rhythmic Jaw Movements Evoked by Electrical Stimulation of Different Cortical Masticatory Areas.J Clin Med. 2023 Jun 5;12(11):3856. doi: 10.3390/jcm12113856. J Clin Med. 2023. PMID: 37298051 Free PMC article.
References
-
- Foster GD. Principles and practices in the management of obesity. Am J Respir Crit Care Med. 2003;168:274–80. - PubMed
-
- Hedley AA, Ogden CL, Johnson CL, Carroll MD, Curtin LR, Flegal KM. Prevalence of overweight and obesity among US children, adolescents, and adults, 1999-2002. JAMA. 2004;291:2847–50. - PubMed
-
- Kuczmarski RJ, Carroll MD, Flegal KM, Troiano RP. Varying body mass index cutoff points to describe overweight prevalence among U.S. adults: NHANES III (1988 to 1994) Obes Res. 1997;5:542–8. - PubMed
-
- Ogden CL, Carroll MD, Curtin LR, McDowell MA, Tabak CJ, Flegal KM. Prevalence of overweight and obesity in the United States. JAMA. 2006;295:1549–55. - PubMed
-
- Ogden C, Carroll M, Kit B, Flegal K. Statistics NCfH, ed. Hyattsville, MD: 2012. Prevalence of obesity in the United States, 2009-2010. NCHS data brief, no 82. - PubMed
MeSH terms
Substances
LinkOut - more resources
Full Text Sources
Other Literature Sources
Medical
Miscellaneous
