

Macroecology Meets Macroeconomics: Resource Scarcity and Global Sustainability
- PMID: 24882946
- PMCID: PMC4036828
- DOI: 10.1016/j.ecoleng.2013.07.071
Macroecology Meets Macroeconomics: Resource Scarcity and Global Sustainability
Abstract
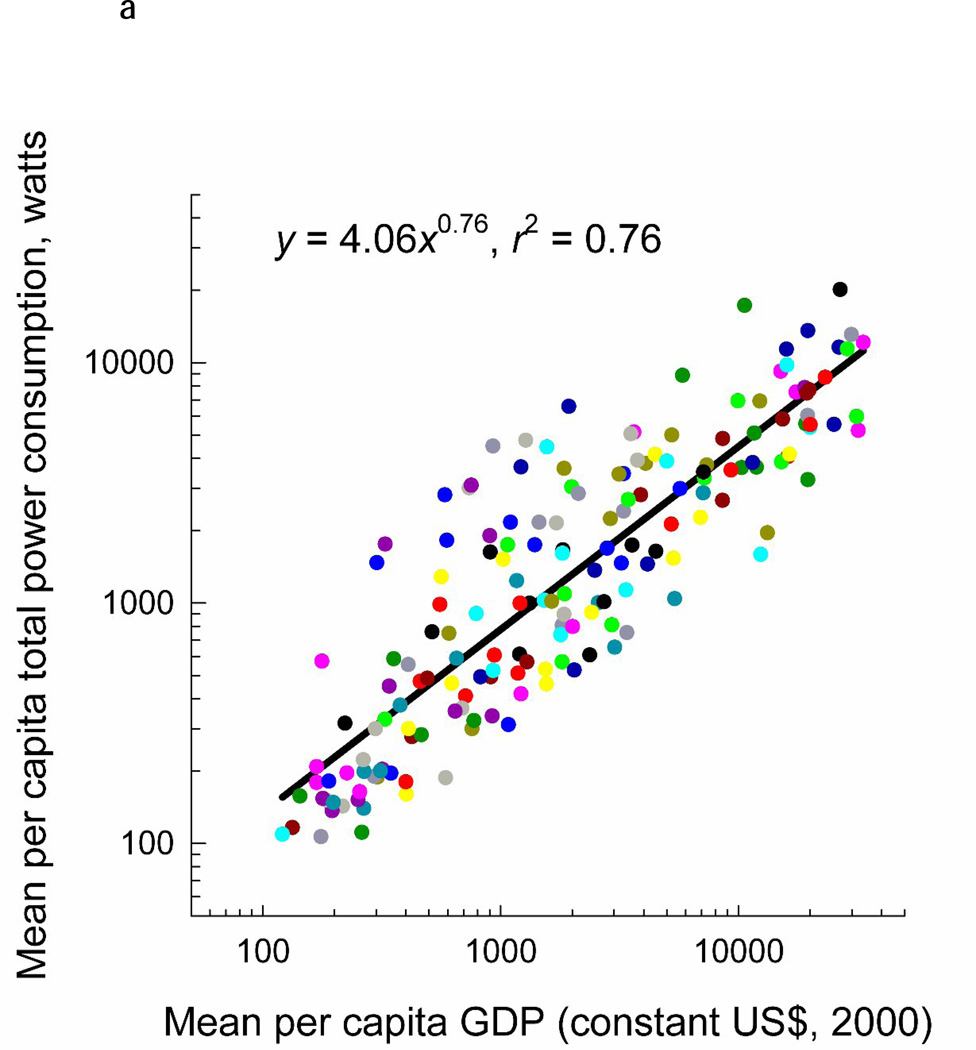
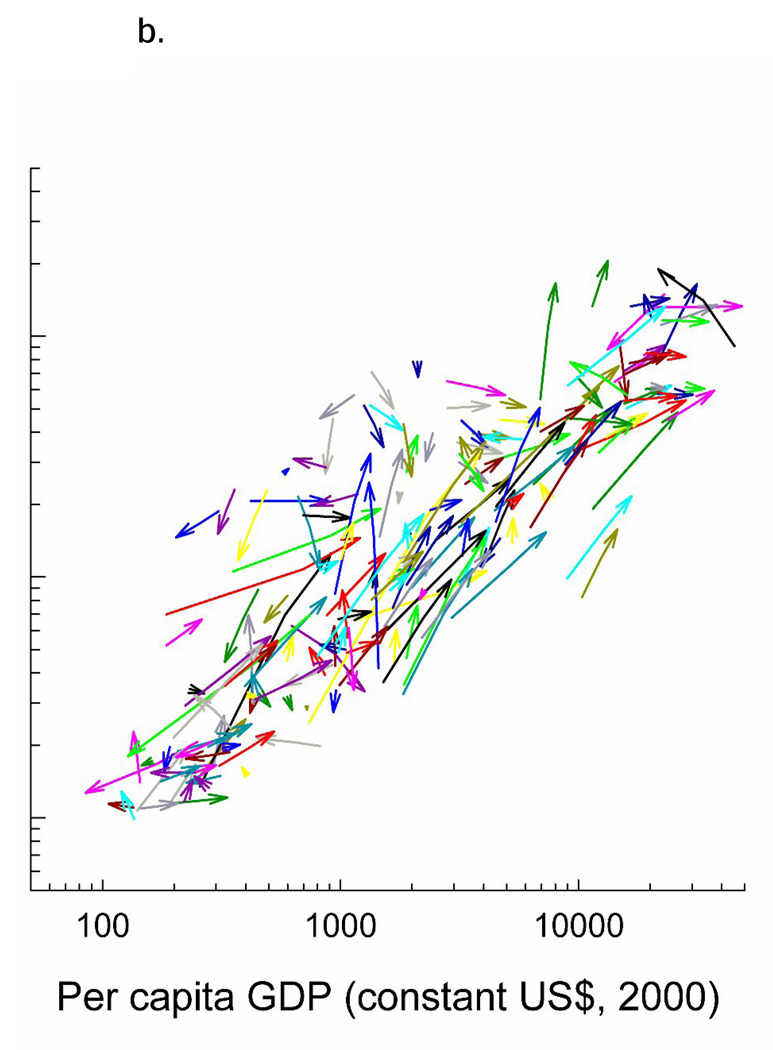
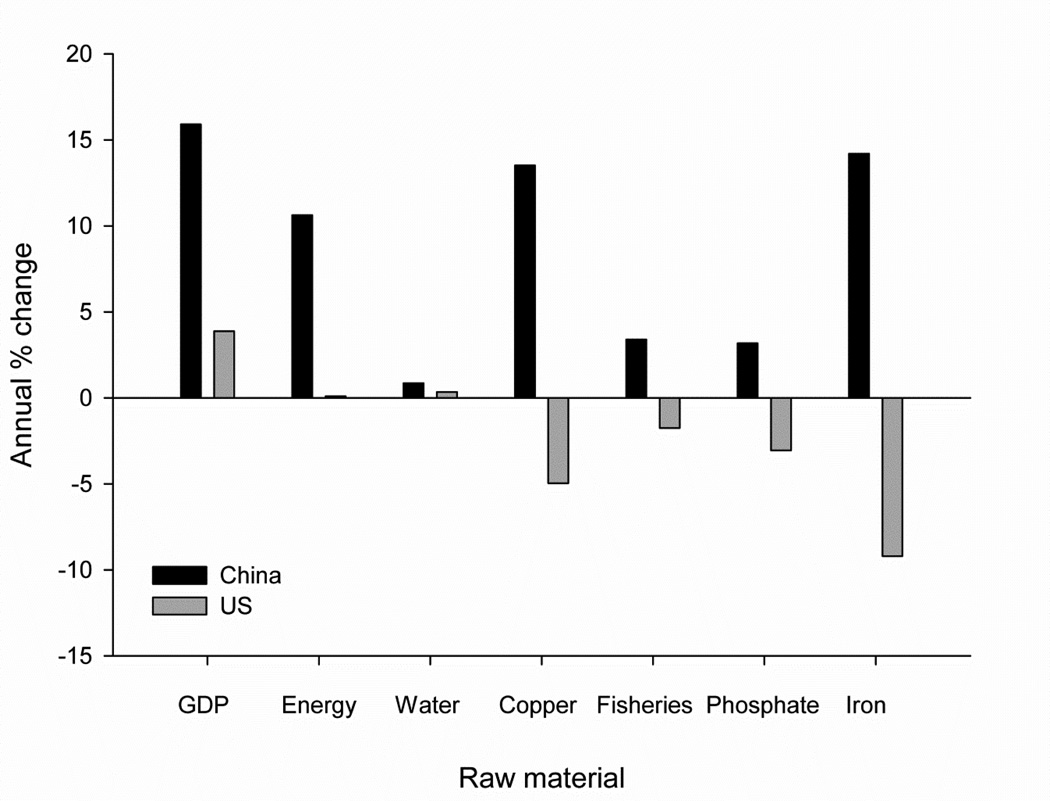
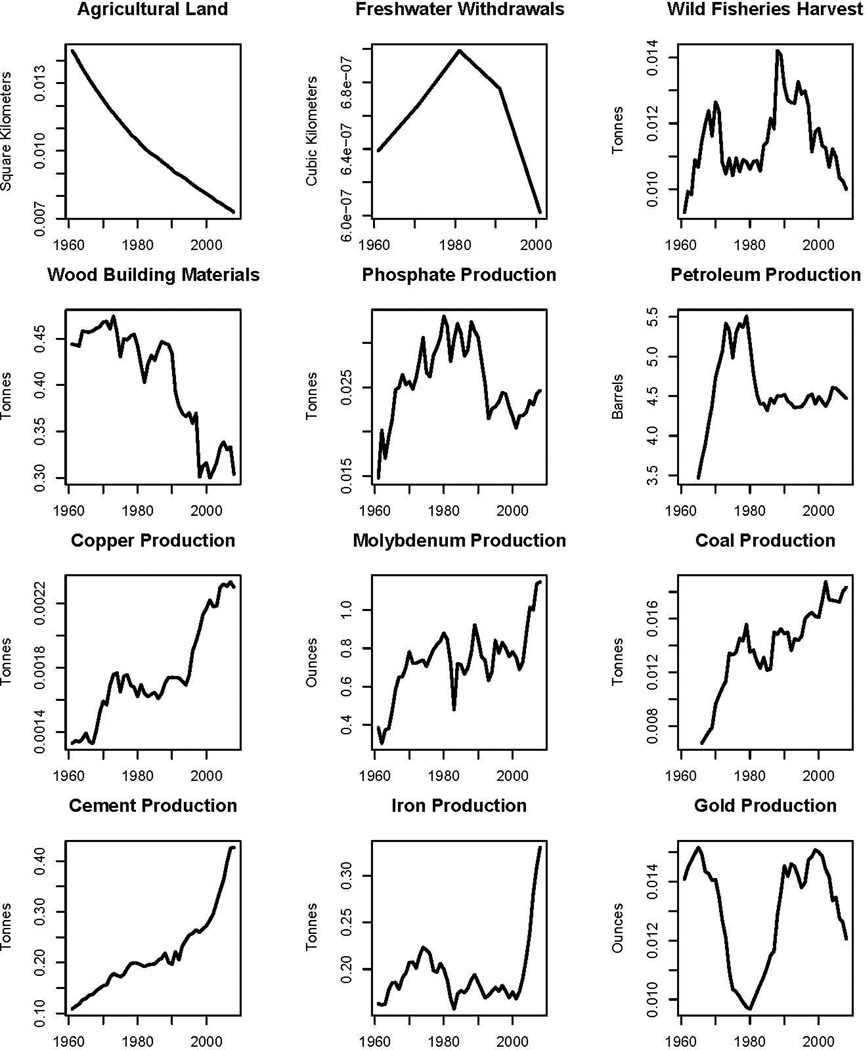
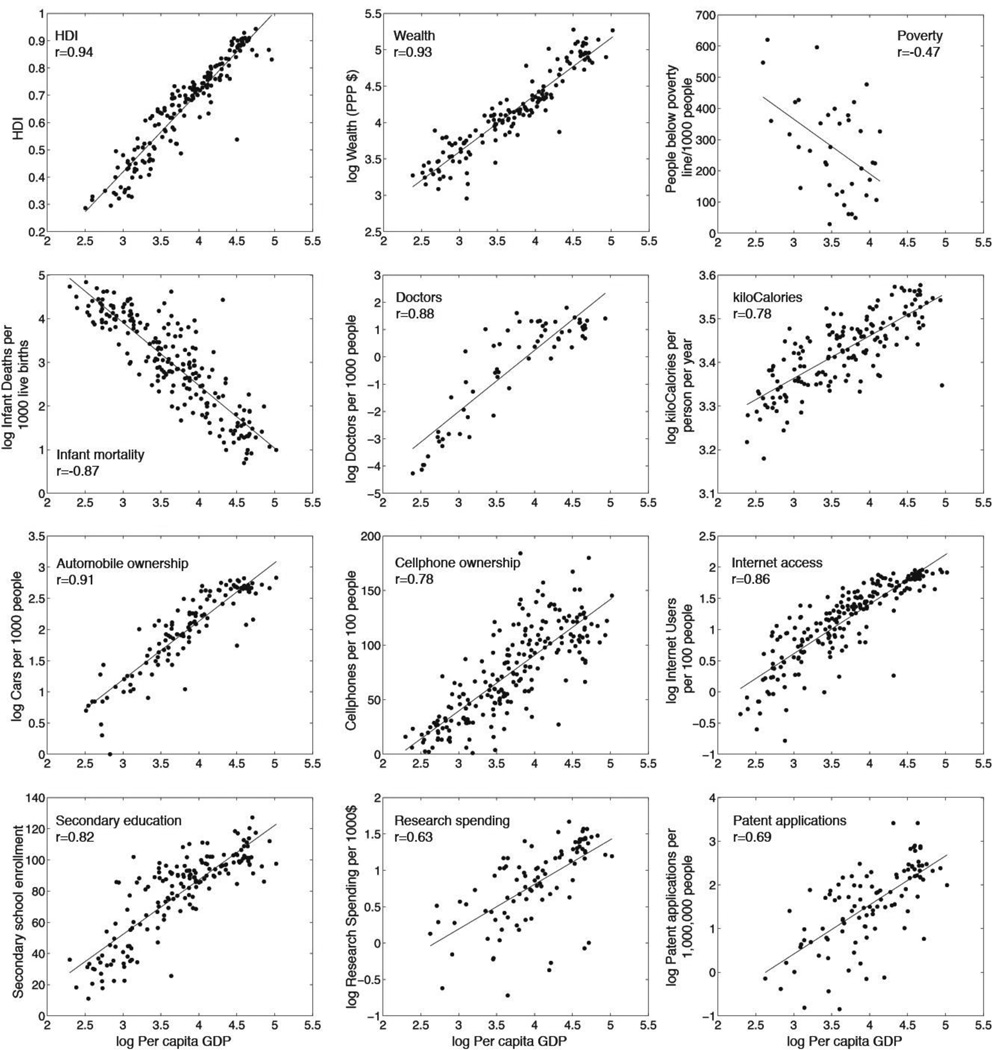
The current economic paradigm, which is based on increasing human population, economic development, and standard of living, is no longer compatible with the biophysical limits of the finite Earth. Failure to recover from the economic crash of 2008 is not due just to inadequate fiscal and monetary policies. The continuing global crisis is also due to scarcity of critical resources. Our macroecological studies highlight the role in the economy of energy and natural resources: oil, gas, water, arable land, metals, rare earths, fertilizers, fisheries, and wood. As the modern industrial technological-informational economy expanded in recent decades, it grew by consuming the Earth's natural resources at unsustainable rates. Correlations between per capita GDP and per capita consumption of energy and other resources across nations and over time demonstrate how economic growth and development depend on "nature's capital". Decades-long trends of decreasing per capita consumption of multiple important commodities indicate that overexploitation has created an unsustainable bubble of population and economy.
Keywords: Ecological economics; Economic growth; Global sustainability; Human ecology; Macroecology; Resource scarcity.
Figures
Similar articles
-
The macroecology of sustainability.PLoS Biol. 2012;10(6):e1001345. doi: 10.1371/journal.pbio.1001345. Epub 2012 Jun 19. PLoS Biol. 2012. PMID: 22723741 Free PMC article.
-
Unmasking decoupling: Redefining the Resource Intensity of the Economy.Sci Total Environ. 2018 Apr 1;619-620:338-351. doi: 10.1016/j.scitotenv.2017.11.061. Epub 2017 Nov 29. Sci Total Environ. 2018. PMID: 29154052
-
Economic development and environmental protection: an ecological economics perspective.Environ Monit Assess. 2003 Jul-Aug;86(1-2):29-45. doi: 10.1023/a:1024098417023. Environ Monit Assess. 2003. PMID: 12858997
-
Natural capital in ecology and economics: an overview.Environ Monit Assess. 2003 Jul-Aug;86(1-2):3-17. doi: 10.1023/a:1024046400185. Environ Monit Assess. 2003. PMID: 12858995 Review.
-
Humanity's unsustainable environmental footprint.Science. 2014 Jun 6;344(6188):1114-7. doi: 10.1126/science.1248365. Science. 2014. PMID: 24904155 Review.
Cited by
-
Diversity begets diversity in mammal species and human cultures.Sci Rep. 2020 Nov 12;10(1):19654. doi: 10.1038/s41598-020-76658-2. Sci Rep. 2020. PMID: 33184380 Free PMC article.
-
Human domination of the biosphere: Rapid discharge of the earth-space battery foretells the future of humankind.Proc Natl Acad Sci U S A. 2015 Aug 4;112(31):9511-7. doi: 10.1073/pnas.1508353112. Epub 2015 Jul 15. Proc Natl Acad Sci U S A. 2015. PMID: 26178196 Free PMC article.
-
The macroecology of the COVID-19 pandemic in the Anthropocene.PLoS One. 2020 Jul 30;15(7):e0236856. doi: 10.1371/journal.pone.0236856. eCollection 2020. PLoS One. 2020. PMID: 32730366 Free PMC article.
-
Scaling of development indicators in countries and its origin.iScience. 2024 Jul 14;27(8):110497. doi: 10.1016/j.isci.2024.110497. eCollection 2024 Aug 16. iScience. 2024. PMID: 39148715 Free PMC article.
-
Planetary Overload, Limits to Growth and Health.Curr Environ Health Rep. 2016 Dec;3(4):360-369. doi: 10.1007/s40572-016-0110-3. Curr Environ Health Rep. 2016. PMID: 27665440 Review.
References
-
- Ash C, Jasny BR, Roberts L, Stone R, Sugden AM. Reimagining cities. Science. 2008;319:739–739. - PubMed
-
- Arrow K, Bolin B, Costanza R, Dasgupta P, Folke C, Holling CS, Jansson B-O, Levin S, Maler K-G, Perrings C, Pimentel D. Economic growth, carrying capacity, and the environment. Science. 1995;268:520–521. - PubMed
-
- Arrow K, Dasgupta P, Goulder L, Daily G, Ehrlich P, Heal G, Levin S, Schneider S, Starrett D, Walker B. Are we consuming too much? Journal of Economic Perspectives. 2004;18:147–172.
-
- Bardi U. The limits to growth revisited. Springer; 2011.
-
- Barnosky AD, Hadly EA, Bascompte J, Berlow EL, Brown JH, Fortelius M, Getz WM, Harte J, Hastings A, Marquet PA, Martinez ND, Mooers A, Roopnarine P, Vermeij G, Williams JW, Gillespie R, Kitzes J, Marshall C, Matzke N, Mindell DP, Revilla E, Smith AD. Approaching a state shift in Earth’s biosphere. Nature. 2012;486:52–58. - PubMed
Grants and funding
LinkOut - more resources
Full Text Sources
Other Literature Sources
Research Materials