

Using eye tracking to assess reading performance in patients with glaucoma: a within-person study
- PMID: 24883203
- PMCID: PMC4026991
- DOI: 10.1155/2014/120528
Using eye tracking to assess reading performance in patients with glaucoma: a within-person study
Abstract
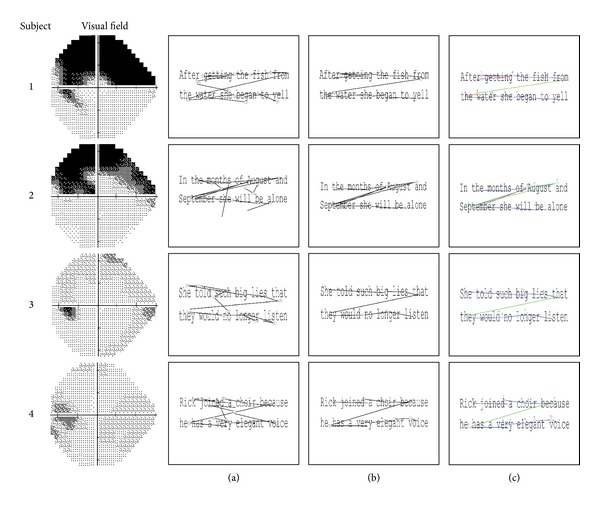
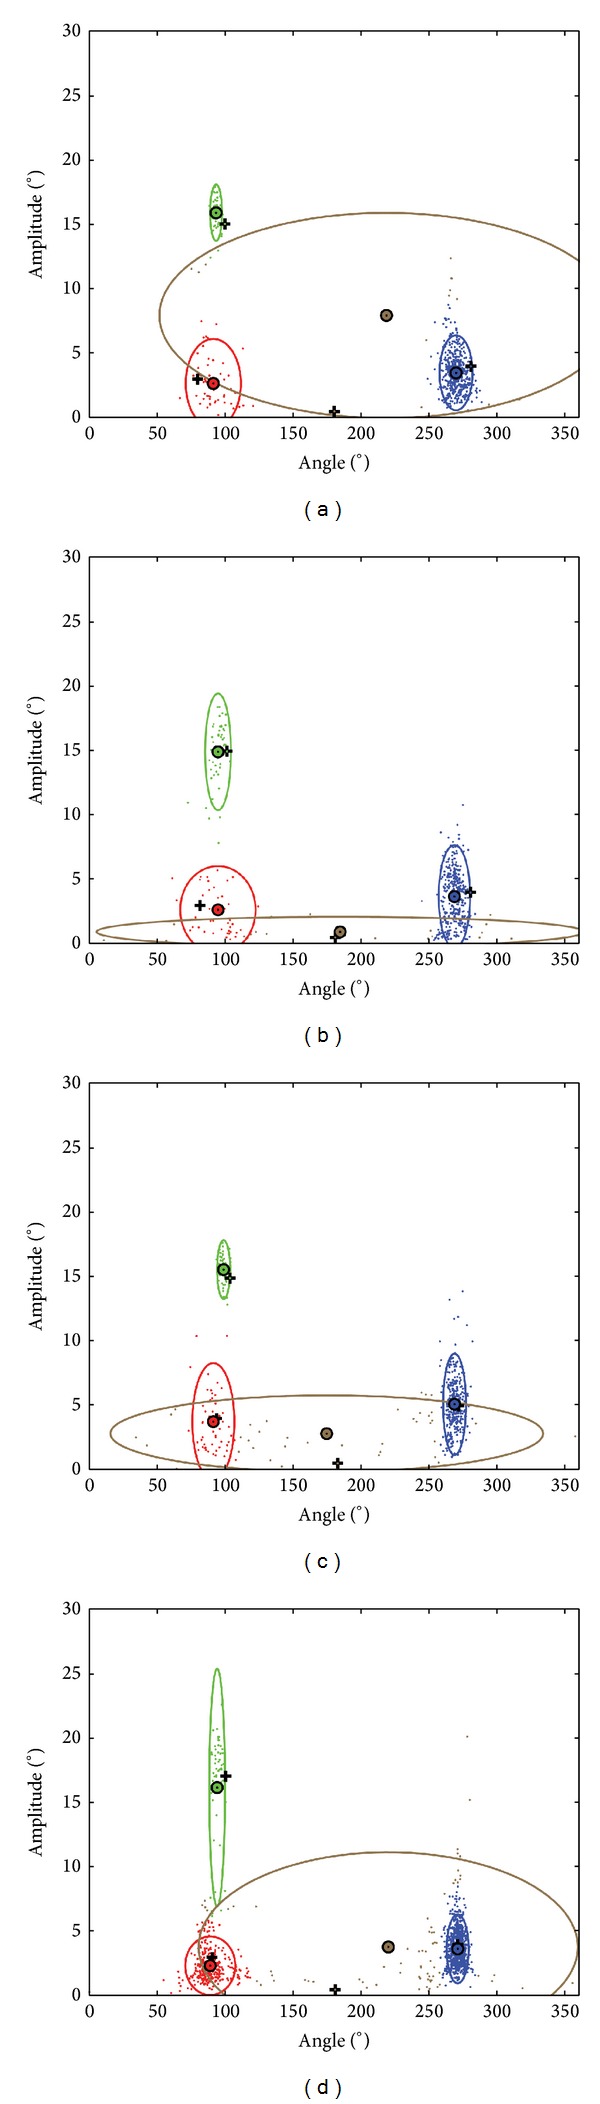
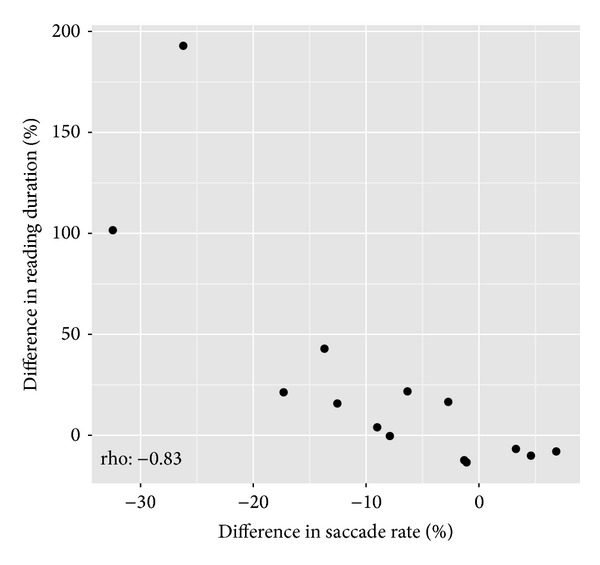
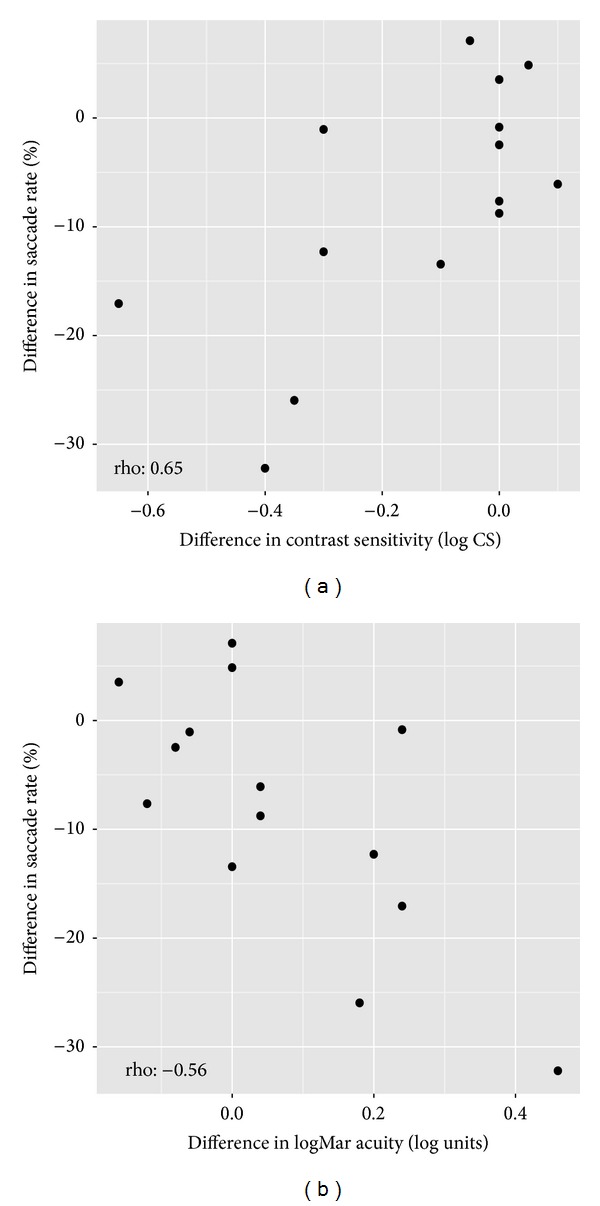
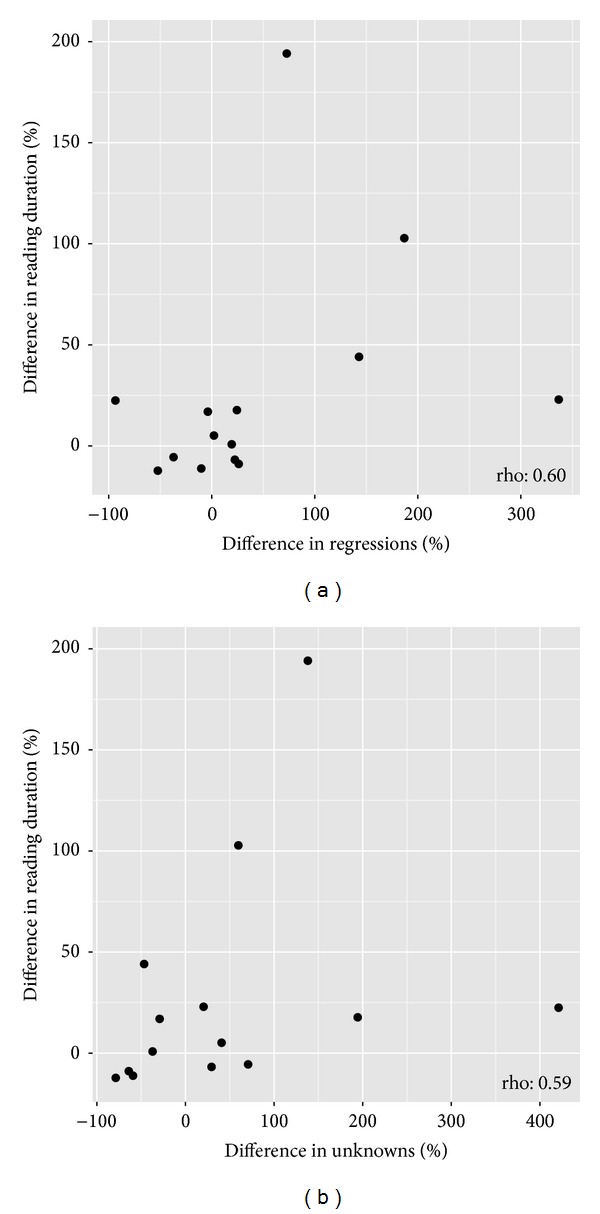
Reading is often cited as a demanding task for patients with glaucomatous visual field (VF) loss, yet reading speed varies widely between patients and does not appear to be predicted by standard visual function measures. This within-person study aimed to investigate reading duration and eye movements when reading short passages of text in a patient's worse eye (most VF damage) when compared to their better eye (least VF damage). Reading duration and saccade rate were significantly different on average in the worse eye when compared to the better eye (P < 0.001) in 14 patients with glaucoma that had median (interquartile range) between-eye difference in mean deviation (MD; a standard clinical measure for VF loss) of 9.8 (8.3 to 14.8) dB; differences were not related to the size of the difference in MD between eyes. Patients with a more pronounced effect of longer reading duration on their worse eye made a larger proportion of "regressions" (backward saccades) and "unknown" EMs (not adhering to expected reading patterns) when reading with the worse eye when compared to the better eye. A between-eye study in patients with asymmetric disease, coupled with eye tracking, provides a useful experimental design for exploring reading performance in glaucoma.
Figures
Similar articles
-
Eye movements during visual search in patients with glaucoma.BMC Ophthalmol. 2012 Aug 31;12:45. doi: 10.1186/1471-2415-12-45. BMC Ophthalmol. 2012. PMID: 22937814 Free PMC article.
-
The relationship between better-eye and integrated visual field mean deviation and visual disability.Ophthalmology. 2013 Dec;120(12):2476-2484. doi: 10.1016/j.ophtha.2013.07.020. Epub 2013 Aug 30. Ophthalmology. 2013. PMID: 23993358 Free PMC article.
-
Eye movements and reading in glaucoma: observations on patients with advanced visual field loss.Graefes Arch Clin Exp Ophthalmol. 2014 Oct;252(10):1621-30. doi: 10.1007/s00417-014-2752-x. Epub 2014 Jul 30. Graefes Arch Clin Exp Ophthalmol. 2014. PMID: 25074043
-
Glaucoma and reading: exploring the effects of contrast lowering of text.Optom Vis Sci. 2012 Sep;89(9):1282-7. doi: 10.1097/OPX.0b013e3182686165. Optom Vis Sci. 2012. PMID: 22885786
-
Evaluating Silent Reading Performance with an Eye Tracking System in Patients with Glaucoma.PLoS One. 2017 Jan 17;12(1):e0170230. doi: 10.1371/journal.pone.0170230. eCollection 2017. PLoS One. 2017. PMID: 28095478 Free PMC article.
Cited by
-
Altered eye movements during reading under degraded viewing conditions: Background luminance, text blur, and text contrast.J Vis. 2022 Sep 2;22(10):4. doi: 10.1167/jov.22.10.4. J Vis. 2022. PMID: 36069942 Free PMC article.
-
Deviated Saccadic Trajectory as a Biometric Signature of Glaucoma.Transl Vis Sci Technol. 2023 Jul 3;12(7):15. doi: 10.1167/tvst.12.7.15. Transl Vis Sci Technol. 2023. PMID: 37440248 Free PMC article.
-
Impact of Glaucomatous Ganglion Cell Damage on Central Visual Function.Annu Rev Vis Sci. 2024 Sep;10(1):425-453. doi: 10.1146/annurev-vision-110223-123044. Annu Rev Vis Sci. 2024. PMID: 39292555 Free PMC article. Review.
-
Zapping 500 faces in less than 100 seconds: Evidence for extremely fast and sustained continuous visual search.Sci Rep. 2018 Aug 20;8(1):12482. doi: 10.1038/s41598-018-30245-8. Sci Rep. 2018. PMID: 30127454 Free PMC article.
-
Speed and accuracy of saccades in patients with glaucoma evaluated using an eye tracking perimeter.BMC Ophthalmol. 2020 Jun 30;20(1):259. doi: 10.1186/s12886-020-01528-4. BMC Ophthalmol. 2020. PMID: 32605609 Free PMC article.
References
-
- Aspinall PA, Johnson ZK, Azuara-Blanco A, Montarzino A, Brice R, Vickers A. Evaluation of quality of life and priorities of patients with glaucoma. Investigative Ophthalmology and Visual Science. 2008;49(5):1907–1915. - PubMed
-
- Viswanathan AC, McNaught AI, Poinoosawmy D, et al. Severity and stability of glaucoma patient perception compared with objective measurement. Archives of Ophthalmology. 1999;117(4):450–454. - PubMed
-
- Freeman EE, Muñoz B, West SK, Jampel HD, Friedman DS. Glaucoma and quality of life: the salisbury eye evaluation. Ophthalmology. 2008;115(2):233–238. - PubMed
LinkOut - more resources
Full Text Sources
Other Literature Sources
Miscellaneous
