. 2014 Jun 11;136(23):8157-60.
doi: 10.1021/ja502726s. Epub 2014 Jun 2.

Extremely elevated room-temperature kinetic isotope effects quantify the critical role of barrier width in enzymatic C-H activation

Affiliations

Extremely elevated room-temperature kinetic isotope effects quantify the critical role of barrier width in enzymatic C-H activation

Shenshen Hu et al. J Am Chem Soc. .

Abstract

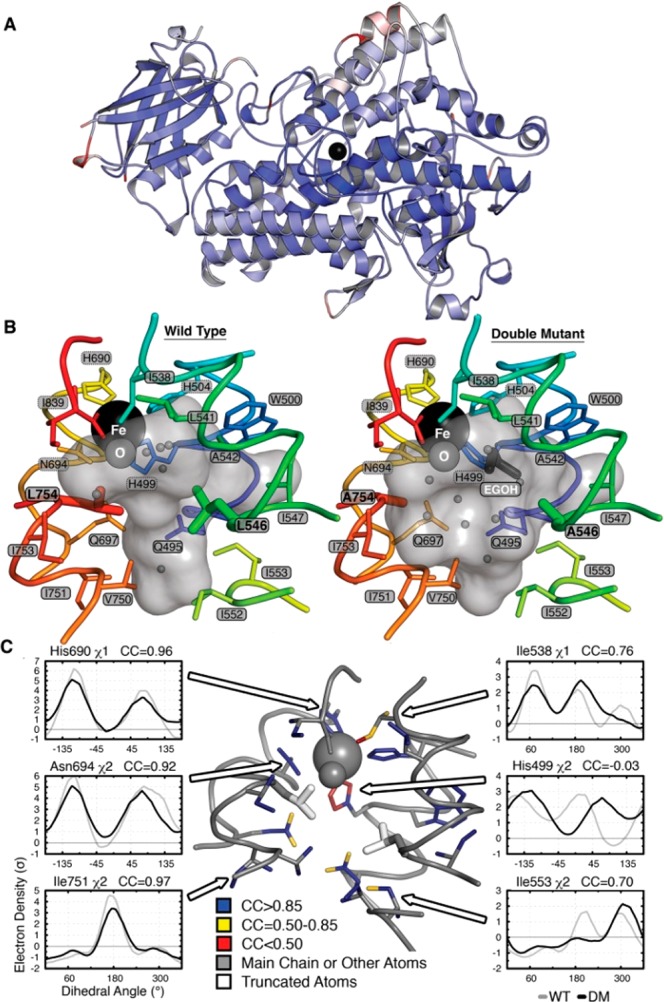
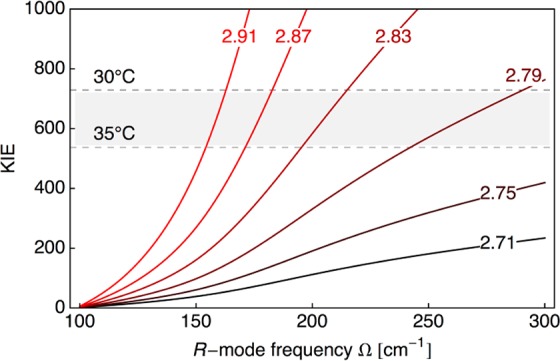
The enzyme soybean lipoxygenase (SLO) has served as a prototype for hydrogen-tunneling reactions, as a result of its unusual kinetic isotope effects (KIEs) and their temperature dependencies. Using a synergy of kinetic, structural, and theoretical studies, we show how the interplay between donor-acceptor distance and active-site flexibility leads to catalytic behavior previously predicted by quantum tunneling theory. Modification of the size of two hydrophobic residues by site-specific mutagenesis in SLO reduces the reaction rate 10(4)-fold and is accompanied by an enormous and unprecedented room-temperature KIE. Fitting of the kinetic data to a non-adiabatic model implicates an expansion of the active site that cannot be compensated by donor-acceptor distance sampling. A 1.7 Å resolution X-ray structure of the double mutant further indicates an unaltered backbone conformation, almost identical side-chain conformations, and a significantly enlarged active-site cavity. These findings show the compelling property of room-temperature hydrogen tunneling within a biological context and demonstrate the very high sensitivity of such tunneling to barrier width.


Figures

Figure 1
Figure 1
Crystal structure of DM SLO. (A) Superposition of the ribbon diagrams of WT and DM SLO with the Fe (black sphere) in the center. Colors represent Cα-RMS displacements from 0 Å (blue) to 0.5 Å (white) to 1 Å (red). (B) Solvent-accessible surface of the active-site cavity in the WT and DM SLO structures. The mutations make the cavity larger, allowing binding of ethylene glycol (dark gray sticks) and altering the water (small gray spheres) distribution. (C) Side-chain populations are similar in the DM and WT enzymes. Side chains lining the cavity are colored according to the correlation coefficient (CC) of the electron density (σ) sampled around each dihedral angle using the program Ringer. CC values above 0.85 (blue) reflect nearly identical conformational distributions, while CC values of 0.85–0.5 (yellow) or below 0.5 (red) reflect increasingly larger population shift. Representative plots of electron density vs dihedral angle show similar distributions (left) and the three largest differences (right).
Figure 2
Figure 2
Kinetic traces of DM SLO. (A) Time course of reaction of DM SLO (1 μM in the reaction mixture) with 33 μM d2-LA at 30 °C in 0.1 M borate, pH 9. At specific times, a 3 mL aliquot was acidified, methylene chloride was extracted, and the solution was evaporated and HPLC-separated. The points were obtained from the area of the product peak at 234 nm. (B) Typical absorbance change at 330 nm during preactivation of DM SLO by adding 2 equiv of 13-(S)-HPOD. (C,D) Pre-steady-state kinetic traces for absorbance at 330 nm vs time for the anaerobic reaction between ferric SLO and linoleic acid. Reaction of protio-LA at 35 °C is shown in C, and that of d2-LA is shown in D. The UV–vis spectrophotometer was reset to zero when substrate was added, leading to negative values of absorbance in C,D.
Figure 3
Figure 3
Predicted KIE for DM SLO as a function of the donor–acceptor equilibrium distance (Req) and the frequency of the donor–acceptor distance sampling (Ω). The curves are labeled according to Req given in Å. In this model, the reorganization energy is λ = 45.616 kcal/mol, the reaction free energy is ΔG° = −5.4 kcal/mol, and no additional work term is included. The shaded area of the plot corresponds to the experimental range of the observed KIE between 30 and 35 °C. The corresponding plot with λ = 13.408 kcal/mol and an additional work term of W = 7.723 kcal/mol is given in Figure S10 in the SI.

References

    1. Wolfenden R. Acc. Chem. Res. 1972, 5, 10. - PubMed
    1. Cha Y.; Murray C. J.; Kliman J. P. Science 1989, 243, 1325. - PubMed
    1. Zhang J.; Klinman J. P. J. Am. Chem. Soc. 2011, 133, 17134. - PMC - PubMed
    1. Schwartz S. D.; Schramm V. L. Nat. Chem. Biol. 2009, 5, 551. - PMC - PubMed
    1. Hay S.; Scrutton N. S. Nat. Chem. 2012, 29, 161. - PubMed

Publication types

LinkOut - more resources