. 2014 May 20:14:131.
doi: 10.1186/1471-2180-14-131.

Multilocus sequence typing and ftsI sequencing: a powerful tool for surveillance of penicillin-binding protein 3-mediated beta-lactam resistance in nontypeable Haemophilus influenzae

Affiliations

Multilocus sequence typing and ftsI sequencing: a powerful tool for surveillance of penicillin-binding protein 3-mediated beta-lactam resistance in nontypeable Haemophilus influenzae

Dagfinn Skaare et al. BMC Microbiol. .

Abstract

Background: Beta-lactam resistance in Haemophilus influenzae due to ftsI mutations causing altered penicillin-binding protein 3 (PBP3) is increasing worldwide. Low-level resistant isolates with the N526K substitution (group II low-rPBP3) predominate in most geographical regions, while high-level resistant isolates with the additional S385T substitution (group III high-rPBP3) are common in Japan and South Korea.Knowledge about the molecular epidemiology of rPBP3 strains is limited. We combined multilocus sequence typing (MLST) and ftsI/PBP3 typing to study the emergence and spread of rPBP3 in nontypeable H. influenzae (NTHi) in Norway.

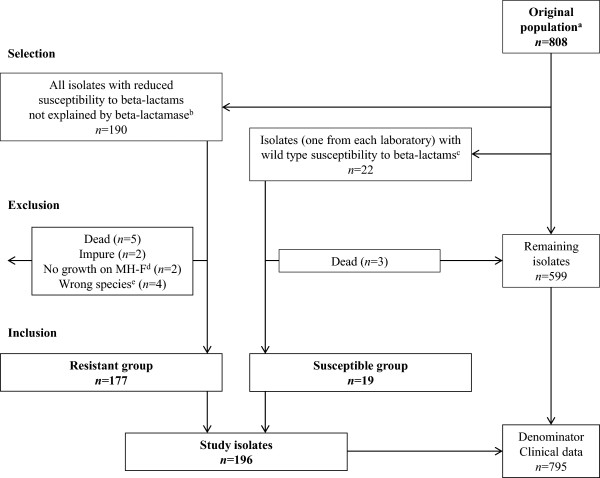
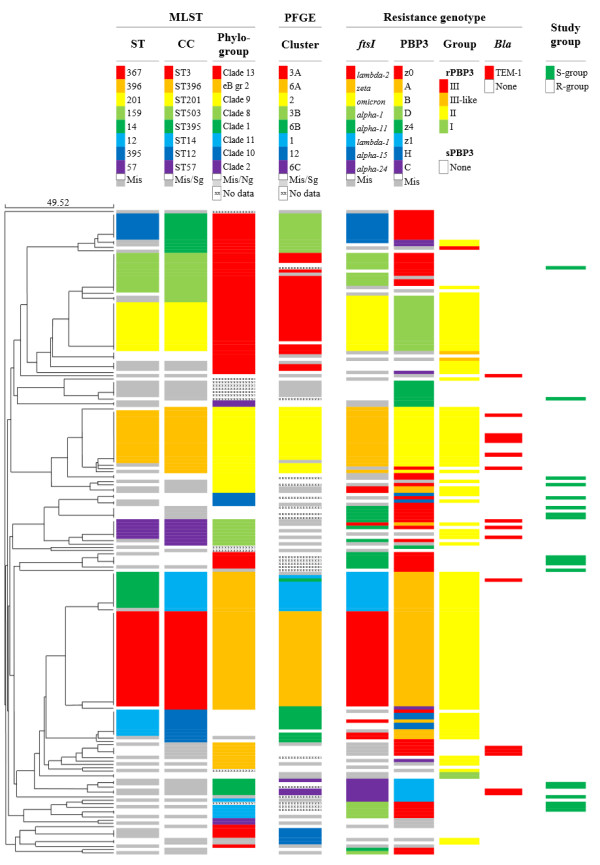
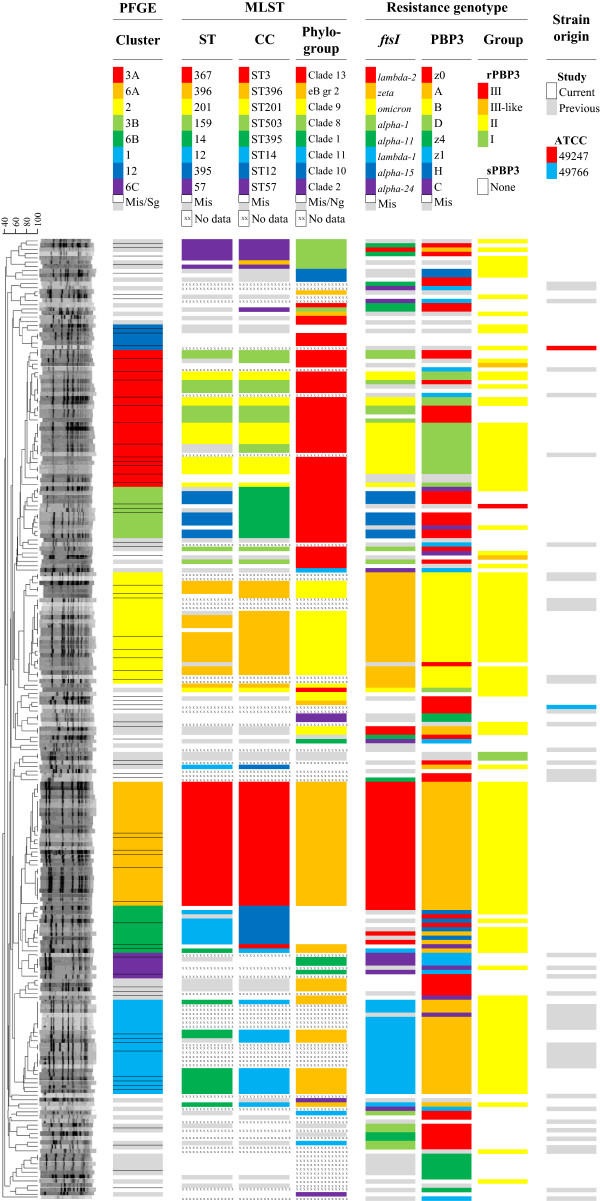
Results: The prevalence of rPBP3 in a population of 795 eye, ear and respiratory isolates (99% NTHi) from 2007 was 15%. The prevalence of clinical PBP3-mediated resistance to ampicillin was 9%, compared to 2.5% three years earlier. Group II low-rPBP3 predominated (96%), with significant proportions of isolates non-susceptible to cefotaxime (6%) and meropenem (20%). Group III high-rPBP3 was identified for the first time in Northern Europe.Four MLST sequence types (ST) with characteristic, highly diverging ftsI alleles accounted for 61% of the rPBP3 isolates. The most prevalent substitution pattern (PBP3 type A) was present in 41% of rPBP3 isolates, mainly carried by ST367 and ST14. Several unrelated STs possessed identical copies of the ftsI allele encoding PBP3 type A.Infection sites, age groups, hospitalization rates and rPBP3 frequencies differed between STs and phylogenetic groups.

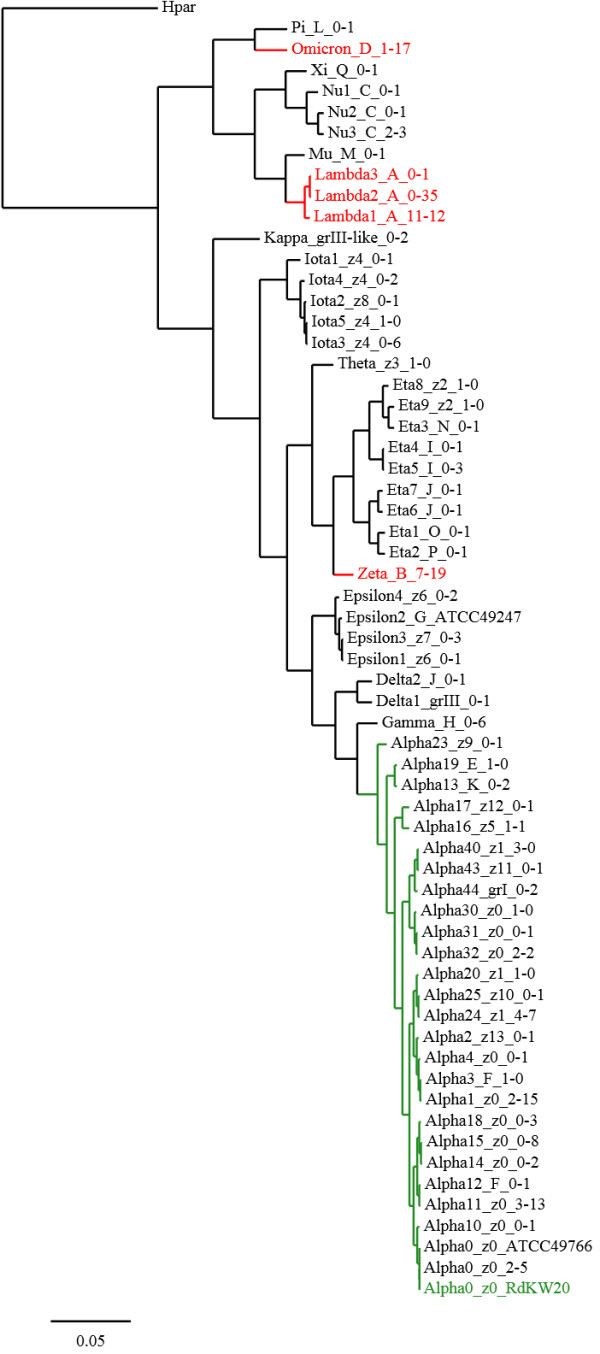
Conclusions: This study is the first to link ftsI alleles to STs in H. influenzae. The results indicate that horizontal gene transfer contributes to the emergence of rPBP3 by phylogeny restricted transformation.Clonally related virulent rPBP3 strains are widely disseminated and high-level resistant isolates emerge in new geographical regions, threatening current empiric antibiotic treatment. The need of continuous monitoring of beta-lactam susceptibility and a global system for molecular surveillance of rPBP3 strains is underlined. Combining MLST and ftsI/PBP3 typing is a powerful tool for this purpose.


Figures

Figure 1
Figure 1
Study isolates. Flowchart showing selection and inclusion of bacterial isolates. aNORM 2007 surveillance population [33]. bAccording to phenotypic susceptibility profiles (by gradient MIC, disk diffusion and beta-lactamase detection) as reported by the primary laboratories. The following selection criteria were used: amoxicillin-clavulanate MIC ≥2 mg/L, cefuroxime MIC ≥4 mg/L, cefotaxime MIC ≥0.12 mg/L and/or cefaclor 30 μg zone <17 mm (all isolates); and ampicillin MIC ≥1 mg/L, phenoxymethylpenicillin 10 μg zone <13 mm and/or ampicillin 2 μg zone <16 mm (beta-lactamase negative isolates). The selection criteria were constructed using epidemiological cut-off MIC values defined by EUCAST (http://www.eucast.org/MIC_distributions) and zone diameter distributions from the surveillance report [33]. Information about the methodologies for susceptibility testing are included in the surveillance report [33]. cOne beta-lactamase negative isolate from each laboratory, randomly selected from the isolates remaining after selection for the Resistant group. dMH-F, Mueller-Hinton agar supplemented with defibrinated horse blood and β-NAD for susceptibility testing of fastidious organisms (http://www.eucast.org). eH. parainfluenzae (n = 3) and H. haemolyticus (n = 1).
Figure 2
Figure 2
ftsI phylogram. UPGMA phylogram of ftsI DNA sequences (transpeptidase domain, nucleotides 1010–1719) in the current (n = 196) and previous study (n = 46) [11]. The outgroup (Hpar) is H. parainfluenzae [EMBL:AB267856] and the reference sequence (z0) is H. influenzae Rd KW20 [GenBank:U32793]. The H. influenzae reference strains ATCC 49247 and ATCC 49766 are also included. The scale is DNA sequence divergence (0.05 = 5% divergence). Labels indicate ftsI alleles, PBP3 types and number of isolates with the particular allele in the previous and current study, respectively. The reference cluster alpha (green) and the alleles encoding PBP3 types A, B and D (red) are highlighted.
Figure 3
Figure 3
MLST dendrogram. The correlation between phylogenetic groups (MLST and PFGE) and resistance genotypes. UPGMA dendrogram of STs based on pair-wise differences in allelic profiles of the 196 study isolates with additional information about CCs, phylogroups, PFGE clusters, ftsI alleles, PBP3 types, PBP3 groups, beta-lactamase and study groups. The colour scale indicates relative frequencies of various alternatives within each of the columns 1–6. eB gr2, eBURST group 2; Mis, miscellaneous; Sg, singletons; Ng, no phylogroup; S-group, Susceptible group; R-group, Resistant group.
Figure 4
Figure 4
PFGE dendrogram. The correlation between phylogenetic groups (PFGE and MLST) and resistance genotypes. UPGMA dendrogram of band patterns for the 177 isolates in the Resistant group and 46 isolates from a previous study [11]. Clusters of related or possibly related isolates by analysis of band patterns and Dice coefficient of similarity are indicated by colours. Horizontal lines separate different band patterns. Additional information about STs, CCs, phylogroups, ftsI alleles, PBP3 types, PBP3 groups and strain origin is provided. The colour scale (similar to Figure 3) indicates relative frequencies of various alternatives within each of the columns 1–6. eB gr2, eBURST group 2; Mis, miscellaneous; Sg, singletons; Ng, no phylogroup.

Similar articles

Cited by

References

    1. Jordens JZ, Slack MPE. Haemophilus influenzae: Then and now. Eur J Clin Microbiol Infect Dis. 1995;14:935–948. doi: 10.1007/BF01691374. - DOI - PubMed
    1. Sill ML, Tsang RSW. Antibiotic susceptibility of invasive Haemophilus influenzae strains in Canada. Antimicrob Agents Chemother. 2008;52:1551–1552. doi: 10.1128/AAC.01580-07. - DOI - PMC - PubMed
    1. Shuel M, Hoang L, Law DKS, Tsang R. Invasive Haemophilus influenzae in British Columbia: non-Hib and non-typeable strains causing disease in children and adults. Int J Infect Dis. 2011;15:e167–e173. doi: 10.1016/j.ijid.2010.10.005. - DOI - PubMed
    1. Resman F, Ristovski M, Forsgren A, Kaijser B, Kronvall G, Medstrand P, Melander E, Odenholt I, Riesbeck K. Increase of beta-lactam-resistant invasive Haemophilus influenzae in Sweden, 1997 to 2010. Antimicrob Agents Chemother. 2012;56:4408–4415. doi: 10.1128/AAC.00415-12. - DOI - PMC - PubMed
    1. Murphy T. Current and future prospects for a vaccine for nontypeable Haemophilus influenzae. Curr Infect Dis Rep. 2009;11:177–182. doi: 10.1007/s11908-009-0027-1. - DOI - PubMed

Publication types

MeSH terms

Substances

LinkOut - more resources