

EXPRSS: an Illumina based high-throughput expression-profiling method to reveal transcriptional dynamics
- PMID: 24884414
- PMCID: PMC4035070
- DOI: 10.1186/1471-2164-15-341
EXPRSS: an Illumina based high-throughput expression-profiling method to reveal transcriptional dynamics
Abstract
Background: Next Generation Sequencing technologies have facilitated differential gene expression analysis through RNA-seq and Tag-seq methods. RNA-seq has biases associated with transcript lengths, lacks uniform coverage of regions in mRNA and requires 10-20 times more reads than a typical Tag-seq. Most existing Tag-seq methods either have biases or not high throughput due to use of restriction enzymes or enzymatic manipulation of 5' ends of mRNA or use of RNA ligations.
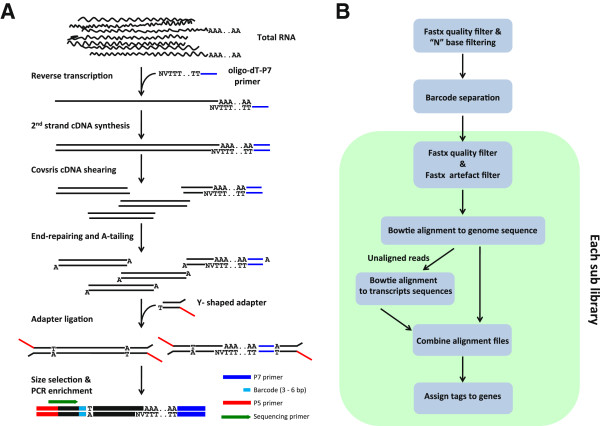
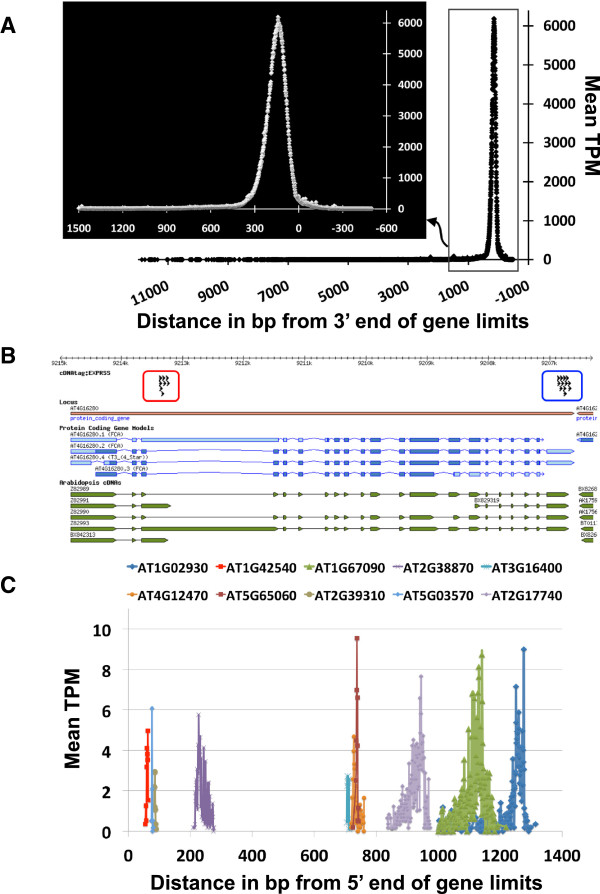
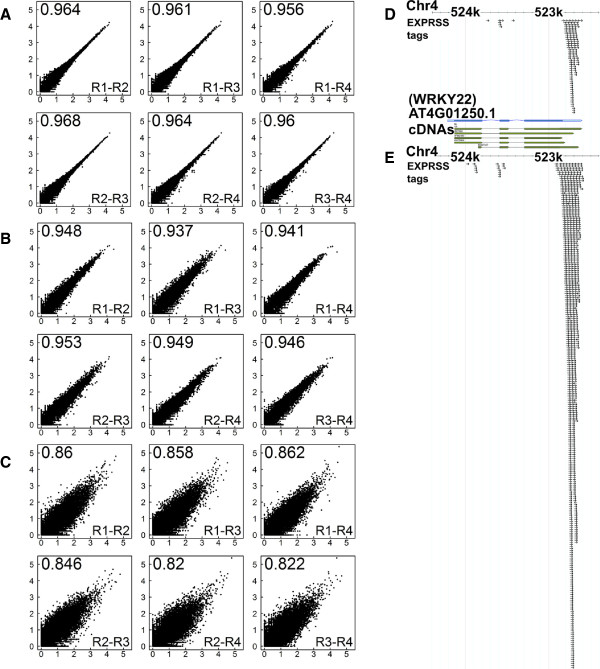
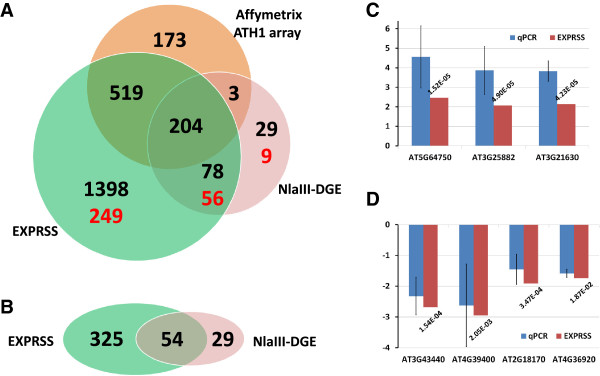
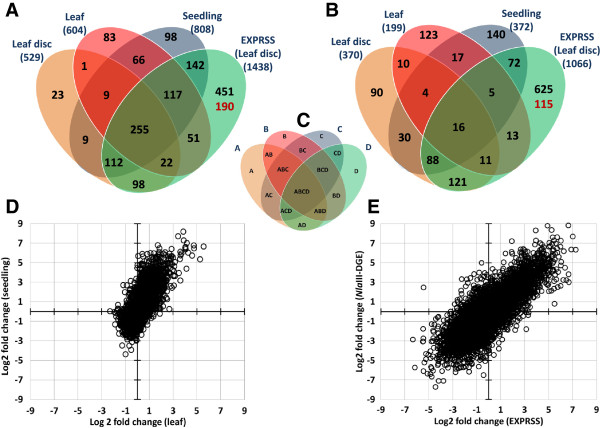
Results: We have developed EXpression Profiling through Randomly Sheared cDNA tag Sequencing (EXPRSS) that employs acoustic waves to randomly shear cDNA and generate sequence tags at a relatively defined position (~150-200 bp) from the 3' end of each mRNA. Implementation of the method was verified through comparative analysis of expression data generated from EXPRSS, NlaIII-DGE and Affymetrix microarray and through qPCR quantification of selected genes. EXPRSS is a strand specific and restriction enzyme independent tag sequencing method that does not require cDNA length-based data transformations. EXPRSS is highly reproducible, is high-throughput and it also reveals alternative polyadenylation and polyadenylated antisense transcripts. It is cost-effective using barcoded multiplexing, avoids the biases of existing SAGE and derivative methods and can reveal polyadenylation position from paired-end sequencing.
Conclusions: EXPRSS Tag-seq provides sensitive and reliable gene expression data and enables high-throughput expression profiling with relatively simple downstream analysis.
Figures
Similar articles
-
Alternative polyadenylation analysis in animals and plants: newly developed strategies for profiling, processing and validation.Int J Biol Sci. 2018 Sep 7;14(12):1709-1714. doi: 10.7150/ijbs.27168. eCollection 2018. Int J Biol Sci. 2018. PMID: 30416385 Free PMC article. Review.
-
Transcript Profiling Using Long-Read Sequencing Technologies.Methods Mol Biol. 2018;1783:121-147. doi: 10.1007/978-1-4939-7834-2_6. Methods Mol Biol. 2018. PMID: 29767360
-
High-throughput RNA-seq for allelic or locus-specific expression analysis in Arabidopsis-related species, hybrids, and allotetraploids.Methods Mol Biol. 2014;1112:33-48. doi: 10.1007/978-1-62703-773-0_3. Methods Mol Biol. 2014. PMID: 24478006
-
Poly(A)-ClickSeq: click-chemistry for next-generation 3΄-end sequencing without RNA enrichment or fragmentation.Nucleic Acids Res. 2017 Jul 7;45(12):e112. doi: 10.1093/nar/gkx286. Nucleic Acids Res. 2017. PMID: 28449108 Free PMC article.
-
[Transcriptomes for serial analysis of gene expression].J Soc Biol. 2002;196(4):303-7. J Soc Biol. 2002. PMID: 12645300 Review. French.
Cited by
-
Downy Mildew effector HaRxL21 interacts with the transcriptional repressor TOPLESS to promote pathogen susceptibility.PLoS Pathog. 2020 Aug 12;16(8):e1008835. doi: 10.1371/journal.ppat.1008835. eCollection 2020 Aug. PLoS Pathog. 2020. PMID: 32785253 Free PMC article.
-
Jellyfish Bioactive Compounds: Methods for Wet-Lab Work.Mar Drugs. 2016 Apr 12;14(4):75. doi: 10.3390/md14040075. Mar Drugs. 2016. PMID: 27077869 Free PMC article. Review.
-
Effector-Triggered Immune Response in Arabidopsis thaliana Is a Quantitative Trait.Genetics. 2016 Sep;204(1):337-53. doi: 10.1534/genetics.116.190678. Epub 2016 Jul 13. Genetics. 2016. PMID: 27412712 Free PMC article.
-
Oxicam-type non-steroidal anti-inflammatory drugs inhibit NPR1-mediated salicylic acid pathway.Nat Commun. 2021 Dec 15;12(1):7303. doi: 10.1038/s41467-021-27489-w. Nat Commun. 2021. PMID: 34911942 Free PMC article.
-
Role of AT1G72910, AT1G72940, and ADR1-LIKE 2 in Plant Immunity under Nonsense-Mediated mRNA Decay-Compromised Conditions at Low Temperatures.Int J Mol Sci. 2020 Oct 27;21(21):7986. doi: 10.3390/ijms21217986. Int J Mol Sci. 2020. PMID: 33121126 Free PMC article.
References
Publication types
MeSH terms
Substances
Associated data
- Actions
Grants and funding
LinkOut - more resources
Full Text Sources
Other Literature Sources
Molecular Biology Databases
