. 2014 May 12:15:362.
doi: 10.1186/1471-2164-15-362.

Construction and verification of the transcriptional regulatory response network of Streptococcus mutans upon treatment with the biofilm inhibitor carolacton

Construction and verification of the transcriptional regulatory response network of Streptococcus mutans upon treatment with the biofilm inhibitor carolacton

Padhmanand Sudhakar et al. BMC Genomics. .

Erratum in

  • BMC Genomics. 2014;15:739. Dobler, Irene W [corrected to Wagner-Döbler, Irene]

Abstract

Background: Carolacton is a newly identified secondary metabolite causing altered cell morphology and death of Streptococcus mutans biofilm cells. To unravel key regulators mediating these effects, the transcriptional regulatory response network of S. mutans biofilms upon carolacton treatment was constructed and analyzed. A systems biological approach integrating time-resolved transcriptomic data, reverse engineering, transcription factor binding sites, and experimental validation was carried out.

Results: The co-expression response network constructed from transcriptomic data using the reverse engineering algorithm called the Trend Correlation method consisted of 8284 gene pairs. The regulatory response network inferred by superimposing transcription factor binding site information into the co-expression network comprised 329 putative transcriptional regulatory interactions and could be classified into 27 sub-networks each co-regulated by a transcription factor. These sub-networks were significantly enriched with genes sharing common functions. The regulatory response network displayed global hierarchy and network motifs as observed in model organisms. The sub-networks modulated by the pyrimidine biosynthesis regulator PyrR, the glutamine synthetase repressor GlnR, the cysteine metabolism regulator CysR, global regulators CcpA and CodY and the two component system response regulators VicR and MbrC among others could putatively be related to the physiological effect of carolacton. The predicted interactions from the regulatory network between MbrC, known to be involved in cell envelope stress response, and the murMN-SMU_718c genes encoding peptidoglycan biosynthetic enzymes were experimentally confirmed using Electro Mobility Shift Assays. Furthermore, gene deletion mutants of five predicted key regulators from the response networks were constructed and their sensitivities towards carolacton were investigated. Deletion of cysR, the node having the highest connectivity among the regulators chosen from the regulatory network, resulted in a mutant which was insensitive to carolacton thus demonstrating not only the essentiality of cysR for the response of S. mutans biofilms to carolacton but also the relevance of the predicted network.

Conclusion: The network approach used in this study revealed important regulators and interactions as part of the response mechanisms of S. mutans biofilm cells to carolacton. It also opens a door for further studies into novel drug targets against streptococci.


Figures

Figure 1
Figure 1
Workflow to capture the network level effects of the biofilm inhibitor carolacton on S. mutans biofilms. The directions of the arrow marks denote the flow of data processing and sequential steps. Shapes of boxes have no particular significance while the descriptions within the boxes represent the steps corresponding to data generation, algorithms, data processing, network and experimental analyses. *indicates the reference [32].
Figure 2
Figure 2
Topological view of the transcriptional regulatory response network (TRRN) of S. mutans biofilms upon carolacton treatment. The TRRN was inferred by overlaying the regulator-target gene binding site map onto the co-expression network. It consisted of 27 co-regulated gene groups or subnetworks each under the control of a transcription factor and comprised 329 regulatory interactions involving 307 genes. Some of the co-regulated gene groups overlap with each other as a result of genes modulated by more than one transcription factor. The 27 regulators with outgoing connections (marked with red circles) along with 10 other regulators only with incoming connections (marked with black circles) found to be among target genes within the sub-networks are indicated as well as non-regulator target genes (indicated by green circles). If the upstream regulatory regions of the target genes or their corresponding operons harbored multiple putative binding sites of its predicted regulator(s), then they are indicated by orange circles). In addition, the regulators with outgoing connections are also marked with their gene names above their respective nodes. Blue arrows indicate a positive (activation) relationship whereas red arrows stand for a negative (repression) effect. Connections always flow from top to bottom. Spatial positions of transcription factor nodes are manipulated so as to pictorially depict the possible hierarchies. The carolacton context TRRN shown herein is observed to be organized as a double layered hierarchy. The network was visualized using Cytoscape.
Figure 3
Figure 3
Categorical enrichment within the sub-networks comprising the S. mutans biofilms TRRN upon carolacton treatment. The co-regulated groups or sub-networks within the TRRN were found to be enriched with functional categories such as KEGG metabolic pathways, biological functional classes and gene ontology terms thus lending biological meaning to the inferred regulatory response network. Co-regulated groups denote sets of genes predicted to be commonly modulated by a transcription factor (indicated by filled pink rectangles). The regulatory response network also includes other transcriptional factors with only incoming connections (black rectangles in bold) and found to be among the co-regulated groups. Some of the co-regulated groups were found to be enriched with functional categories such as KEGG metabolic pathways (octagons), biological functional classes (circles) and gene ontology terms (triangles) whereas others (black circles filled in with letters ‘UK’) did not display any enrichment. Black edges with ellipsoid target edges represent relationships with dual regulation (some of the transcriptional regulatory relationships within the sub-network are characterized by positive (activational) expression patterns and others by inverted (repressive) expression patterns between the regulator and the target gene). The meanings of all the other arrow symbols are as described in the legend of Figure 2.
Figure 4
Figure 4
Heat map representation of the transcriptional response of the S. mutans pyrimidine metabolic pathway upon carolacton treatment. Genes from the pyrimidine metabolism pathway were among the first to be modulated upon carolacton treatment. The log2-fold expression change of pathway genes at 5 min post treatment were used for the heat-map representation. Green indicates upregulation and red downregulation. The scale is indicative of the corresponding changes in normalized gene expression. Pathway genes encoding enzymes catalyzing reactions leading up to UMP were strongly upregulated while most of the other pathway genes exhibited relatively weak modulation. Enzymes marked in black bold rectangles indicate the corresponding strongly upregulated transcripts of the pathway. White cells correspond to pathway enzymes not found in the genome of S. mutans UA159. If a particular enzyme corresponds to multiple transcripts (as a result of multiple protein subunits constituting an enzyme), then the transcript with the highest amplitude of log2-fold change was used. Graph generated using the Mayday visualization tool version 2.12.
Figure 5
Figure 5
Normalized expression profiles of genes modulated by selected transcription factors in response to carolacton treatment. (A) The normalized expression profiles of the genes co-regulated by the pyrimidine biosynthesis regulatory protein in the carolacton treatment context TRRN of S. mutans. Two operons containing genes encoding enzymes involved in the biosynthesis of pyrimidine ribonucleotides were upregulated sharply by about 1.8 to 2 log2-fold 5 min post carolacton treatment. (B) The expression dynamics of the genes co-regulated by the glutamine repressor GlnR in response to carolacton treatment. (C) The normalized expression profiles of the genes commonly regulated by the downregulated essential TCS response regulator vicR in response to carolacton. VicR modulated genes include those encoding virulence attributing products such as glucosyltransferases B and D, cell wall protein WapE among others. (D) Temporal behavior of the 26 genes found within the co-regulated group/subnetwork commonly modulated by SMU.852 encoding the CysR cysteine metabolism regulatory protein. Co-regulated gene groups were constructed by overlaying predicted regulator-binding site maps onto the co-expression network as shown here (E) specifically for the network confined to cysR. The node corresponding to the lone regulator (SMU.1509 encoding a putative Rgg family transcription factor) in the gene group co-regulated by CysR is marked in grey.
Figure 6
Figure 6
Experimental verification of the predicted transcriptional regulation of the murMN- SMU_718c operon by the response regulator MbrC. The predicted transcriptional regulatory relationship was based on a well correlated (A) expression profile between mbrC and the murMN-SMU_718 operon as well as the presence of a (B) putative MbrC binding site (TTACAA-AT-TTCTAC) in the upstream regulatory regions of the murMN-SMU_718 operon. The alignment among the MbrC binding sites in other experimentally verified targets (black) reported by Ouyang et al. [50] and the putative site upstream of the predicted target (red) murMN-SMU_718 operon is shown. The signature repeats of the MbrC binding motif are italicized, underlined and shown in bold. (C) Binding of MbrC to the promoter region of the gene SMU_1006 (positive control) was verified using Electro Mobility Shift Assays (EMSA), as already reported by Ouyang et al.[50]. (D) EMSA also provided the verification of the in-vitro binding of the MbrC protein to the promoter region of the predicted target murMN-SMU_718c operon via the putative binding site thus confirming that the latter is a transcriptional regulatory target of MbrC. The triangles indicate increasing concentrations of MbrC in the binding reactions. Black triangles followed by IR indicate target DNA fragments lacking the MbrC binding site.
Figure 7
Figure 7
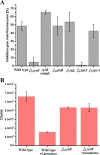
Effect of deleting five “key” transcriptional regulators and sensitivity of the cysR deletion mutant to carolacton treatment. (A) Inhibition of viability caused by carolacton treatment was tested for the biofilms of gene deletion mutants of 5 key transcriptional regulators identified from network analysis. The inhibition of viability was determined by live/dead staining of 20 h-old static biofilms of mutant, wild type and cysR complementation strains under carolacton treatment and is expressed as inhibition of the green/red fluorescence ratio. The bars show the mean of three independent biological replicates. (B) The effect of carolacton treatment on the number of colony forming units (cfu’s) of biofilms of the S. mutans UA159 wildtype and cysR gene deletion mutant was also investigated. The Cfu experiment was repeated in two biological replicates. The sequences of primers used for generating the deletion mutants are given in Additional file 9.

Similar articles

Cited by

References

    1. Stoodley P, Sauer K, Davies DG, Costerton JW. Biofilms as complex differentiated communities. Annu Rev Microbiol. 2002;56:187–209. doi: 10.1146/annurev.micro.56.012302.160705. - DOI - PubMed
    1. Dufour D, Leung V, Levesque CM. Bacterial biofilm: structure, function, and antimicrobial resistance. Endo Topics. 2012;22(1):2–16. doi: 10.1111/j.1601-1546.2012.00277.x. - DOI
    1. Kunze B, Reck M, Dötsch A, Lemme A, Schummer D, Irschik H, Steinmetz H, Wagner-Döbler I. Damage of Streptococcus mutans biofilms by carolacton, a secondary metabolite from the myxobacterium Sorangium cellulosum. BMC Microbiol. 2010;10:199. doi: 10.1186/1471-2180-10-199. - DOI - PMC - PubMed
    1. Roychoudhury S, Zielinski NA, Ninfa AJ, Allen NE, Jungheim LN, Nicas TI, Chakrabarty AM. Inhibitors of two-component signal transduction systems: inhibition of alginate gene activation in Pseudomonas aeruginosa. Proc Natl Acad Sci U S A. 1993;90:965–969. doi: 10.1073/pnas.90.3.965. - DOI - PMC - PubMed
    1. Reck M, Rutz K, Kunze B, Tomasch J, Surapaneni SK, Schulz S, Wagner-Döbler I. The biofilm inhibitor carolacton disturbs membrane integrity and cell division of Streptococcus mutans through the serine/threonine protein kinase PknB. J Bacteriol. 2011;193:5692–5706. doi: 10.1128/JB.05424-11. - DOI - PMC - PubMed

Publication types

MeSH terms

Associated data