

The HMI™ module: a new tool to study the Host-Microbiota Interaction in the human gastrointestinal tract in vitro
- PMID: 24884540
- PMCID: PMC4039060
- DOI: 10.1186/1471-2180-14-133
The HMI™ module: a new tool to study the Host-Microbiota Interaction in the human gastrointestinal tract in vitro
Abstract
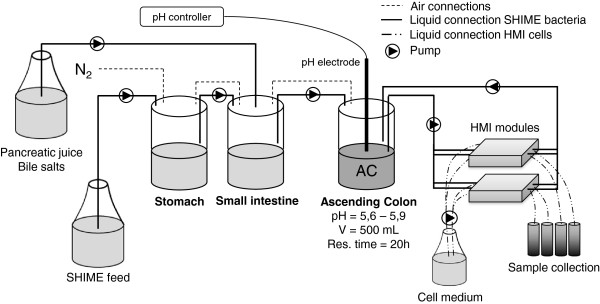
Background: Recent scientific developments have shed more light on the importance of the host-microbe interaction, particularly in the gut. However, the mechanistic study of the host-microbe interplay is complicated by the intrinsic limitations in reaching the different areas of the gastrointestinal tract (GIT) in vivo. In this paper, we present the technical validation of a new device--the Host-Microbiota Interaction (HMI) module--and the evidence that it can be used in combination with a gut dynamic simulator to evaluate the effect of a specific treatment at the level of the luminal microbial community and of the host surface colonization and signaling.
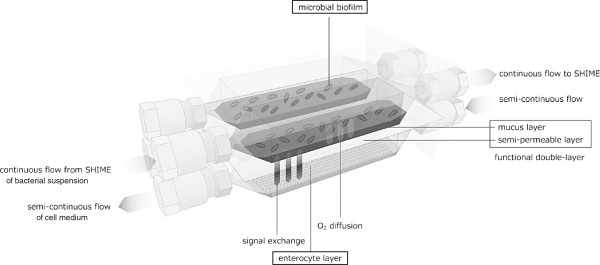
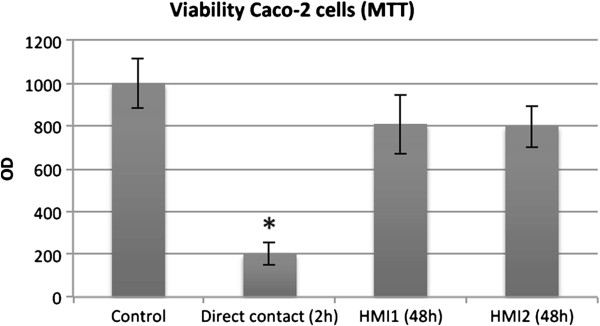
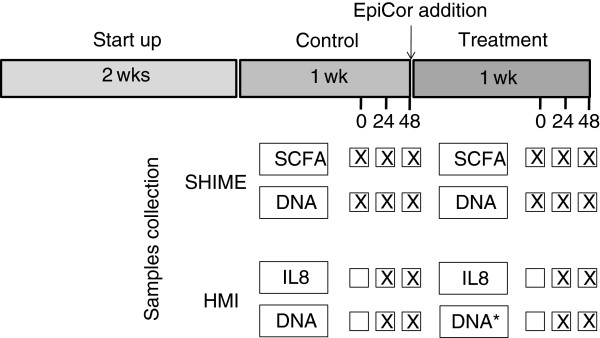
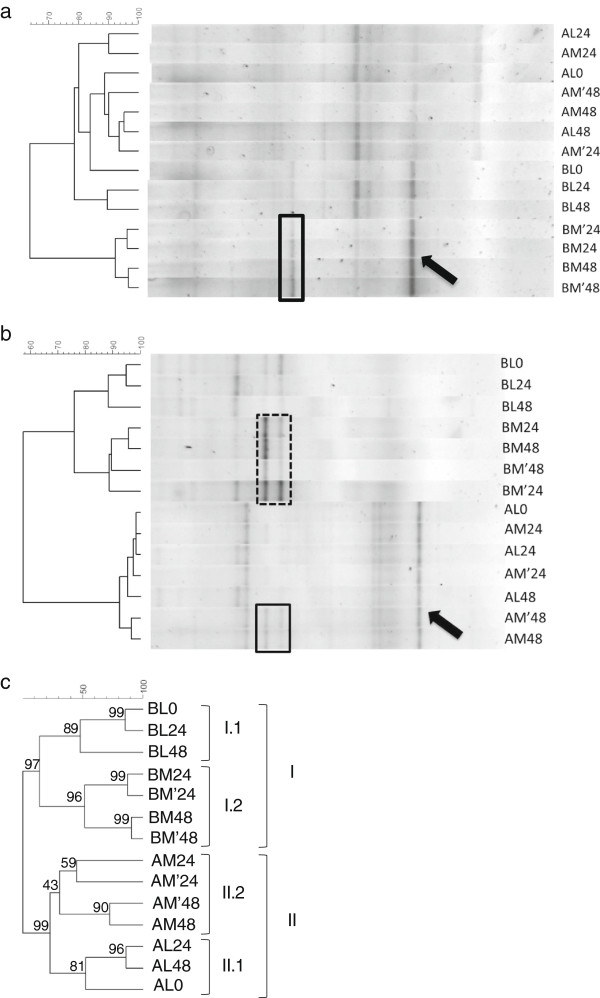
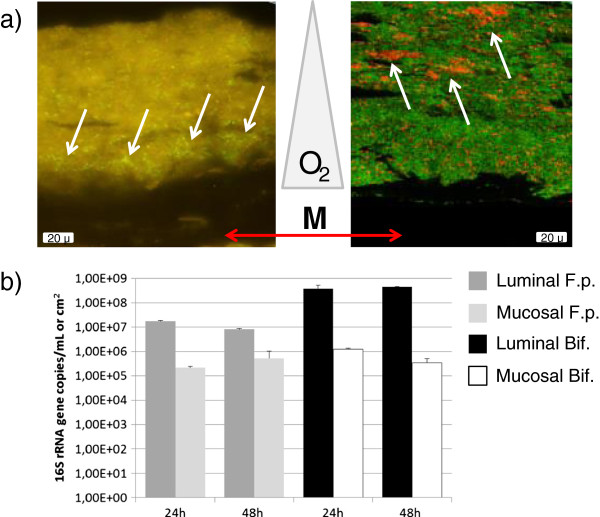
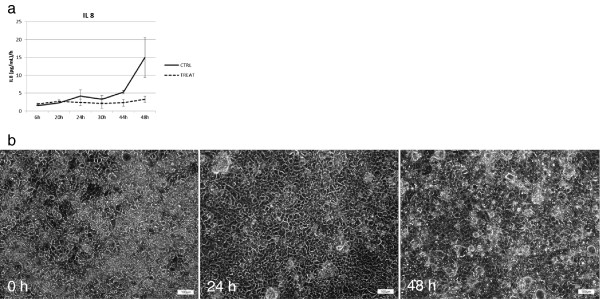
Results: The HMI module recreates conditions that are physiologically relevant for the GIT: i) a mucosal area to which bacteria can adhere under relevant shear stress (3 dynes cm(-2)); ii) the bilateral transport of low molecular weight metabolites (4 to 150 kDa) with permeation coefficients ranging from 2.4 × 10(-6) to 7.1 × 10(-9) cm sec(-1); and iii) microaerophilic conditions at the bottom of the growing biofilm (PmO2 = 2.5 × 10(-4) cm sec(-1)). In a long-term study, the host's cells in the HMI module were still viable after a 48-hour exposure to a complex microbial community. The dominant mucus-associated microbiota differed from the luminal one and its composition was influenced by the treatment with a dried product derived from yeast fermentation. The latter--with known anti-inflammatory properties--induced a decrease of pro-inflammatory IL-8 production between 24 and 48 h.
Conclusions: The study of the in vivo functionality of adhering bacterial communities in the human GIT and of the localized effect on the host is frequently hindered by the complexity of reaching particular areas of the GIT. The HMI module offers the possibility of co-culturing a gut representative microbial community with enterocyte-like cells up to 48 h and may therefore contribute to the mechanistic understanding of host-microbiome interactions.
Figures
Similar articles
-
The role of gut microbiota in health and disease: In vitro modeling of host-microbe interactions at the aerobe-anaerobe interphase of the human gut.Anaerobe. 2017 Apr;44:3-12. doi: 10.1016/j.anaerobe.2017.01.001. Epub 2017 Jan 3. Anaerobe. 2017. PMID: 28062270 Review.
-
The Use of Defined Microbial Communities To Model Host-Microbe Interactions in the Human Gut.Microbiol Mol Biol Rev. 2019 Mar 13;83(2):e00054-18. doi: 10.1128/MMBR.00054-18. Print 2019 May 15. Microbiol Mol Biol Rev. 2019. PMID: 30867232 Free PMC article. Review.
-
Review: The development of the gastrointestinal tract microbiota and intervention in neonatal ruminants.Animal. 2021 Aug;15(8):100316. doi: 10.1016/j.animal.2021.100316. Epub 2021 Jul 20. Animal. 2021. PMID: 34293582 Review.
-
An Advanced In Vitro Technology Platform to Study the Mechanism of Action of Prebiotics and Probiotics in the Gastrointestinal Tract.J Clin Gastroenterol. 2016 Nov/Dec;50 Suppl 2, Proceedings from the 8th Probiotics, Prebiotics & New Foods for Microbiota and Human Health meeting held in Rome, Italy on September 13-15, 2015:S124-S125. doi: 10.1097/MCG.0000000000000711. J Clin Gastroenterol. 2016. PMID: 27741154
-
Ecological and Ontogenetic Components of Larval Lake Sturgeon Gut Microbiota Assembly, Successional Dynamics, and Ecological Evaluation of Neutral Community Processes.Appl Environ Microbiol. 2020 May 5;86(10):e02662-19. doi: 10.1128/AEM.02662-19. Print 2020 May 5. Appl Environ Microbiol. 2020. PMID: 32169941 Free PMC article.
Cited by
-
What can microfluidics do for human microbiome research?Biomicrofluidics. 2020 Oct 5;14(5):051303. doi: 10.1063/5.0012185. eCollection 2020 Sep. Biomicrofluidics. 2020. PMID: 33062112 Free PMC article.
-
In situ, in vivo, and in vitro approaches for studying AMR plasmid conjugation in the gut microbiome.FEMS Microbiol Rev. 2023 Jan 16;47(1):fuac044. doi: 10.1093/femsre/fuac044. FEMS Microbiol Rev. 2023. PMID: 36341518 Free PMC article. Review.
-
Human Gut-Microbiota Interaction in Neurodegenerative Disorders and Current Engineered Tools for Its Modeling.Front Cell Infect Microbiol. 2020 Jul 7;10:297. doi: 10.3389/fcimb.2020.00297. eCollection 2020. Front Cell Infect Microbiol. 2020. PMID: 32733812 Free PMC article. Review.
-
Synthetic gut microbiome: Advances and challenges.Comput Struct Biotechnol J. 2020 Dec 24;19:363-371. doi: 10.1016/j.csbj.2020.12.029. eCollection 2021. Comput Struct Biotechnol J. 2020. PMID: 33489006 Free PMC article. Review.
-
Dual oxic-anoxic co-culture enables direct study of anaerobe-host interactions at the airway epithelial interface.mBio. 2025 May 14;16(5):e0133824. doi: 10.1128/mbio.01338-24. Epub 2025 Apr 9. mBio. 2025. PMID: 40366160 Free PMC article.
References
Publication types
MeSH terms
LinkOut - more resources
Full Text Sources
Other Literature Sources
