

Resistance to simian immunodeficiency virus low dose rectal challenge is associated with higher constitutive TRIM5α expression in PBMC
- PMID: 24884551
- PMCID: PMC4041354
- DOI: 10.1186/1742-4690-11-39
Resistance to simian immunodeficiency virus low dose rectal challenge is associated with higher constitutive TRIM5α expression in PBMC
Abstract
Background: At least six host-encoded restriction factors (RFs), APOBEC3G, TRIM5α, tetherin, SAMHD1, schlafen 11, and Mx2 have now been shown to inhibit HIV and/or SIV replication in vitro. To determine their role in vivo in the resistance of macaques to mucosally-acquired SIV, we quantified both pre-exposure (basal) and post-exposure mRNA levels of these RFs, Mx1, and IFNγ in PBMC, lymph nodes, and duodenum of rhesus macaques undergoing weekly low dose rectal exposures to the primary isolate, SIV/DeltaB670.
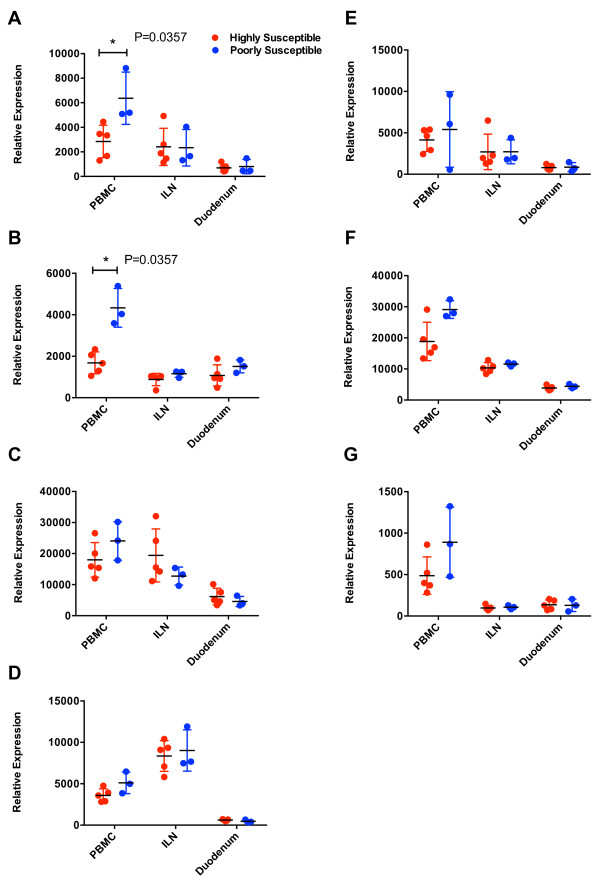
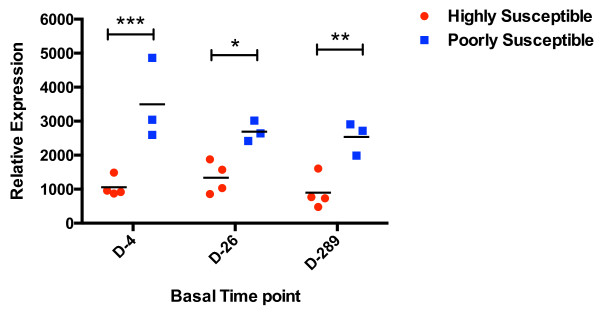
Results: Repetitive challenge divided the monkeys into two groups with respect to their susceptibility to infection: highly susceptible (2-3 challenges, 5 monkeys) and poorly susceptible (≥6 challenges, 3 monkeys). Basal RF and Mx1 expression varied among the three tissues examined, with the lowest expression generally detected in duodenal tissues, and the highest observed in PBMC. The one exception was A3G whose basal expression was greatest in lymph nodes. Importantly, significantly higher basal expression of TRIM5α and Mx1 was observed in PBMC of animals more resistant to mucosal infection. Moreover, individual TRIM5α levels were stable throughout a year prior to infection. Post-exposure induction of these genes was also observed after virus appearance in plasma, with elevated levels in PBMC and duodenum transiently occurring 7-10 days post infection. They did not appear to have an effect on control of viremia. Interestingly, minimal to no induction was observed in the resistant animal that became an elite controller.
Conclusions: These results suggest that constitutively expressed TRIM5α appears to play a greater role in restricting mucosal transmission of SIV than that associated with type I interferon induction following virus entry. Surprisingly, this association was not observed with the other RFs. The higher basal expression of TRIM5α observed in PBMC than in duodenal tissues emphasizes the understated role of the second barrier to systemic infection involving the transport of virus from the mucosal compartment to the blood. Together, these observations provide a strong incentive for a more comprehensive examination of the intrinsic, variable control of constitutive expression of these genes in the sexual transmission of HIV.
Figures


Similar articles
-
The relationship between simian immunodeficiency virus RNA levels and the mRNA levels of alpha/beta interferons (IFN-alpha/beta) and IFN-alpha/beta-inducible Mx in lymphoid tissues of rhesus macaques during acute and chronic infection.J Virol. 2002 Aug;76(16):8433-45. doi: 10.1128/jvi.76.16.8433-8445.2002. J Virol. 2002. PMID: 12134046 Free PMC article.
-
TRIM5α does not affect simian immunodeficiency virus SIV(mac251) replication in vaccinated or unvaccinated Indian rhesus macaques following intrarectal challenge exposure.J Virol. 2011 Dec;85(23):12399-409. doi: 10.1128/JVI.05707-11. Epub 2011 Sep 14. J Virol. 2011. PMID: 21917950 Free PMC article.
-
TRIM5α Resistance Escape Mutations in the Capsid Are Transferable between Simian Immunodeficiency Virus Strains.J Virol. 2016 Nov 28;90(24):11087-11095. doi: 10.1128/JVI.01620-16. Print 2016 Dec 15. J Virol. 2016. PMID: 27681142 Free PMC article.
-
Variability in a dominant block to SIV early reverse transcription in rhesus monkey cells predicts in vivo viral replication and time to death.Virol J. 2010 Apr 26;7:79. doi: 10.1186/1743-422X-7-79. Virol J. 2010. PMID: 20416115 Free PMC article.
-
A Prime/Boost Vaccine Regimen Alters the Rectal Microbiome and Impacts Immune Responses and Viremia Control Post-Simian Immunodeficiency Virus Infection in Male and Female Rhesus Macaques.J Virol. 2020 Nov 23;94(24):e01225-20. doi: 10.1128/JVI.01225-20. Print 2020 Nov 23. J Virol. 2020. PMID: 32967951 Free PMC article.
Cited by
-
IFI44 suppresses HIV-1 LTR promoter activity and facilitates its latency.Virology. 2015 Jul;481:142-50. doi: 10.1016/j.virol.2015.02.046. Epub 2015 Mar 14. Virology. 2015. PMID: 25776761 Free PMC article.
-
Increased BST2 expression during simian immunodeficiency virus infection is not a determinant of disease progression in rhesus monkeys.Retrovirology. 2015 Nov 10;12:92. doi: 10.1186/s12977-015-0219-8. Retrovirology. 2015. PMID: 26554913 Free PMC article.
References
-
- Peng B, Voltan R, Lim L, Edghill-Smith Y, Phogat S, Dimitrov DS, Arora K, Leno M, Than S, Woodward R, Markham PD, Cranage M, Robert-Guroff M. Rhesus macaque resistance to mucosal simian immunodeficiency virus infection is associated with a postentry block in viral replication. J Virol. 2002;76(12):6016–6026. doi: 10.1128/JVI.76.12.6016-6026.2002. - DOI - PMC - PubMed
Publication types
MeSH terms
Substances
Grants and funding
LinkOut - more resources
Full Text Sources
Other Literature Sources
Medical
Miscellaneous
