. 2014 May 7:14:98.
doi: 10.1186/1471-2148-14-98.

Dynamics of a combined Medea-underdominant population transformation system

Affiliations

Dynamics of a combined Medea-underdominant population transformation system

Chaitanya S Gokhale et al. BMC Evol Biol. .

Abstract

Background: Transgenic constructs intended to be stably established at high frequencies in wild populations have been demonstrated to "drive" from low frequencies in experimental insect populations. Linking such population transformation constructs to genes which render them unable to transmit pathogens could eventually be used to stop the spread of vector-borne diseases like malaria and dengue.

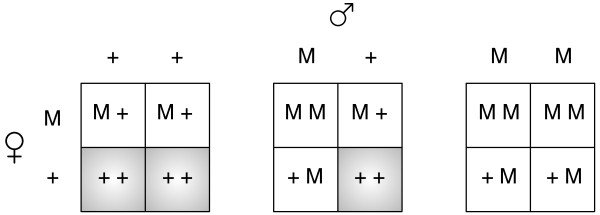
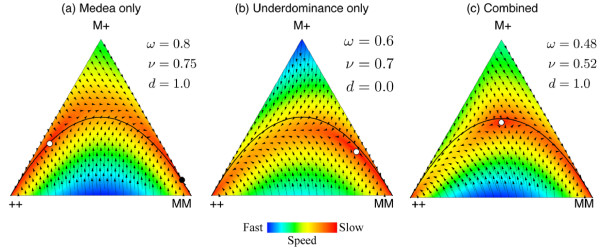
Results: Generally, population transformation constructs with only a single transgenic drive mechanism have been envisioned. Using a theoretical modelling approach we describe the predicted properties of a construct combining autosomal Medea and underdominant population transformation systems. We show that when combined they can exhibit synergistic properties which in broad circumstances surpass those of the single systems.

Conclusion: With combined systems, intentional population transformation and its reversal can be achieved readily. Combined constructs also enhance the capacity to geographically restrict transgenic constructs to targeted populations. It is anticipated that these properties are likely to be of particular value in attracting regulatory approval and public acceptance of this novel technology.


Figures

Figure 1
Figure 1
Effect of the Medea allele is seen in offsprings when mothers are heterozygous for Medea. If the mother is a Medea carrier then she deposits a toxin in the oocytes. Only the offspring who have a copy of the Medea allele are rescued. Thus the wildtype homozygous offspring of a heterozygous mother are affected (shaded) and die with a certain probability d.
Figure 2
Figure 2
de Finetti diagrams for example parameters. At the vertices the complete population consists of the genotype given by that vertex (++ is for the wildtype homozygote, M+ for the heterozygotes and MM for the transgenic homozygotes). In the interior the population composition is a combination of all the three genotypes with frequencies proportional to the perpendicular distance from the vertex. Unstable equilibrium points are shown as white circles and are always internal within the simplex. Stable equilibrium are shown as black circles and occur on edges (the equilibria which always exist at the ++ and MM corners are not shown). The fitness of the wildtype homozygote is assumed to be 1 and the fitnesses of the other genotypes relative to it are given by ω= heterozygotes and ν= homozygotes. The lethality effect of the Medea allele is given by the parameter d. The three panels describe: (a) “Medea only”, an unstable and stable equilibrium occur. These parameters equate to a strong Medea phenotype associated with a significant fitness cost that is substantially dominant. The M allele frequency at the stable threshold is 0.88 and at the unstable threshold is 0.21. (b) “Underdominace only”, an unstable equilibrium occurs, always in the right half of the simplex.These parameters equate to weak underdominace with a significant fitness cost in transgenic homozygotes. The unstable threshold frequency of the M allele is 0.8. (c) A combined Medea and underdominance system, shows only an unstable equilibrium occurs. We assume multiplicative fitness for ν from the values in (a) and (b), The unstable threshold frequency of the M allele is 0.5, which is the ideal threshold for transformation and reversibility (see Appendix). The black line shows the Hardy-Weinberg equilibrium. Note that the system under study easily diverges from the Hardy-Weinberg null model.
Figure 3
Figure 3
Minimum Release Sizes for Population Transformation. Size of release relative to the wild population is plotted as a function of the unstable equilibrium given by the frequency of the Medea allele p=x^+ŷ/2. To achieve population transformation the release size must be above the solid red line (p/(1−p)). To reverse a transformation the release must be above the dashed blue line ((1−p)/p). The combined transformation-reversal release sizes are above the thick black line (1/p(1−p)−2), which has a minimum at p=1/2.
Figure 4
Figure 4
Fitness and its impact on the unstable equilibrium for complete Medea lethality (d=1). The position of the internal unstable equilibrium is illustrated which needs to be traversed for population transformation and for reversal. As the value of ν increases the unstable equilibrium moves closer to the all ++ vertex. The different values of ω trace a curve which intersects the Hardy-Weinberg equilibrium line at ν=ω. For underdominance the fixed points are always below the Hardy-Weinberg curve (also see Figure 7). This also graphically demonstrates Eqs. (A.4) and (A.5) i.e. the frequency of the Medea allele is 1/2 when ν+ω=1 (vertical line, which also represents the ideal with respects to the ease of transformation and its reversal, see Figure 3). Note that when the unstable equilibrium is above the Hardy-Weinberg equilibrium line, there also exists a stable root on the M+ – MM edge given by (x^,ŷ)=(ν2ων,1x^). Disks indicate the positions of results plotted in Figure 2 for the ‘Medea only’ system (M) and the combined system (C).
Figure 5
Figure 5
Numerical solutions for critical times starting at different initial frequencies of the MM genotype. With the parameter values for the combined system (ω=0.48,ν=0.52, Figure 2 C) we begin on the ++ - MM edge at different frequencies. The time required to reach MM frequencies >0.95 are plotted as the critical times. Starting with the frequency of MM genotypes of 0.6 (circles) only if d≥0.85 the system moves to the MM vertex. As the Medea lethality increases the all MM vertex can be reached by starting at lower frequencies of MM genotype. Starting at already high frequencies (0.9, open squares) the time to reach fixation quickly drops to the levels which are almost the same as that of complete Medea lethality. (Initial MM frequencies 0.6 (circles), 0.65 (squares), 0.7 (diamonds), 0.75 (triangles), 0.8 (inverted triangles)). For the recursions, Eqs. (1) were employed.
Figure 6
Figure 6
Critical migration rates allowing stable local transformations over a range of genotype and Medea parameter configurations. Using the recursion equations Eq. (1) with modifications as described in the “Population structure dynamics” section we explore the pattern when there is no Medea effect (d=0) and complete Medea lethality (d=1). For different values of the heterozygote fitness (ω) we explore the genotype configurations going from directional selection to underdominance. The transition in the fitness structure between these two states is indicated within the plots using token bar charts (illustrated graphically within the plots). Over a wide range of parameter space the combined construct exhibits substantially higher critical migration thresholds than ‘underdominance only’. Interestingly the d=1 dynamics are not monotonic. The figure illustrate how migrational stability can be enhanced, even with a reduction in fitness of the genetically modified homozygote. Disks indicate the positions of results plotted in Figure 2 for the ‘underdominance only’ system (U), the combined system (C) and ‘Medea only’ (M). Comparing the combined system with with ‘Medea only’ system we see that not only Medea but underdominance also is necessary to get the desired migrational stability in experimental systems.
Figure 7
Figure 7
The configuration of the stable and unstable equilibrium in the phase space for d=1. The high-frequency unstable equilibrium and stable equilibrium were determined numerically for d=1 over a range of fitness values. In the shaded region an unstable equilibrium exists within the interior of the simplex. In the meshed region a stable equilibrium exists on the M+ to MM edge of the simplex The non-mesh region corresponds to underdominance. The dark diagonal line denotes an ideal unstable threshold in terms of ease of populations transformation and reversal (x^+ŷ/2=1/2) (see Appendix). Disks indicate the positions of results plotted in Figure 2 for the ‘Medea only’ system (M) and the combined system (C).

Similar articles

Cited by

References

    1. Sinkins SP, Gould F. Gene drive systems for insect disease vectors. Nat Rev Gen. 2006;7:427–435. doi: 10.1038/nrg1870. - DOI - PubMed
    1. Ito J, Ghosh A, Moreira LA, Wimmer EA, Jacobs-Lorena M. Transgenic anopheline mosquitoes impaired in transmission of a malaria parasite. Nature. 2002;417:452–455. doi: 10.1038/417452a. - DOI - PubMed
    1. Franz AWE, Sanchez-Vargas I, Adelman ZN, Blair CD, Beaty BJ, James AA, Olson KE. Engineering RNA interference-based resistance to dengue virus type-2 in genetically-modified aedes aegypti. Proc Natl Acad Sci USA. 2006;103:4198–4203. doi: 10.1073/pnas.0600479103. - DOI - PMC - PubMed
    1. Jasinskiene N, Coleman J, Ashikyan A, Salampessy M, Marinotti O. Genetic control of malaria parasite transmission: threshold levels for infection in an avian model system. Am J Trop Med Hyg. 2007;76:1072–1078. - PubMed
    1. Corby-Harris V, Drexler A, Watkins de Jong L, Antonova Y, Pakpour N, Ziegler R, Ramberg F, Lewis E, Brown JM, Luckhart S, Riehle MA. Activation of Akt signaling reduces the prevalence and intensity of malaria parasite infection and lifespan in Anopheles stephensi mosquitoes. PLoS Pathog. 2010;6:1001003. doi: 10.1371/journal.ppat.1001003. - DOI - PMC - PubMed

Publication types