

Complete genome sequence and comparative genomic analyses of the vancomycin-producing Amycolatopsis orientalis
- PMID: 24884615
- PMCID: PMC4048454
- DOI: 10.1186/1471-2164-15-363
Complete genome sequence and comparative genomic analyses of the vancomycin-producing Amycolatopsis orientalis
Abstract
Background: Amycolatopsis orientalis is the type species of the genus and its industrial strain HCCB10007, derived from ATCC 43491, has been used for large-scale production of the vital antibiotic vancomycin. However, to date, neither the complete genomic sequence of this species nor a systemic characterization of the vancomycin biosynthesis cluster (vcm) has been reported. With only the whole genome sequence of Amycolatopsis mediterranei available, additional complete genomes of other species may facilitate intra-generic comparative analysis of the genus.
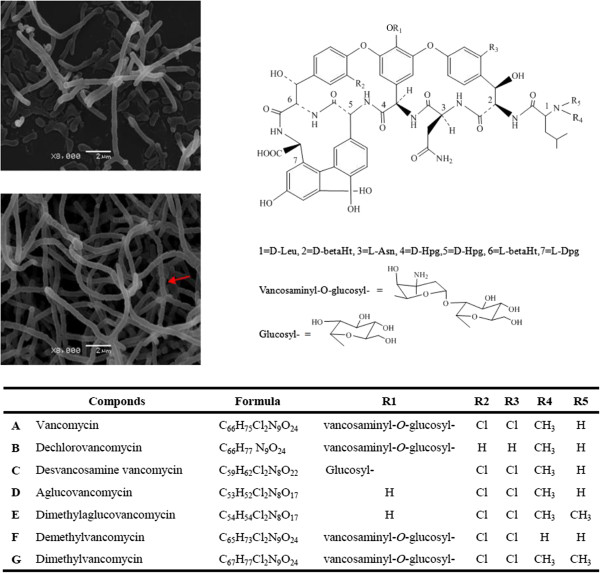
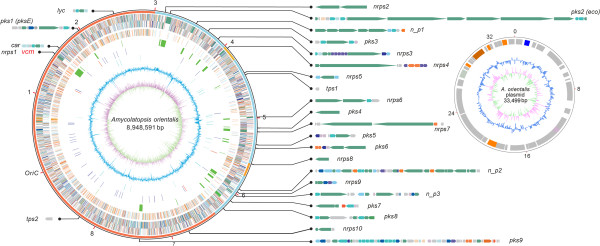
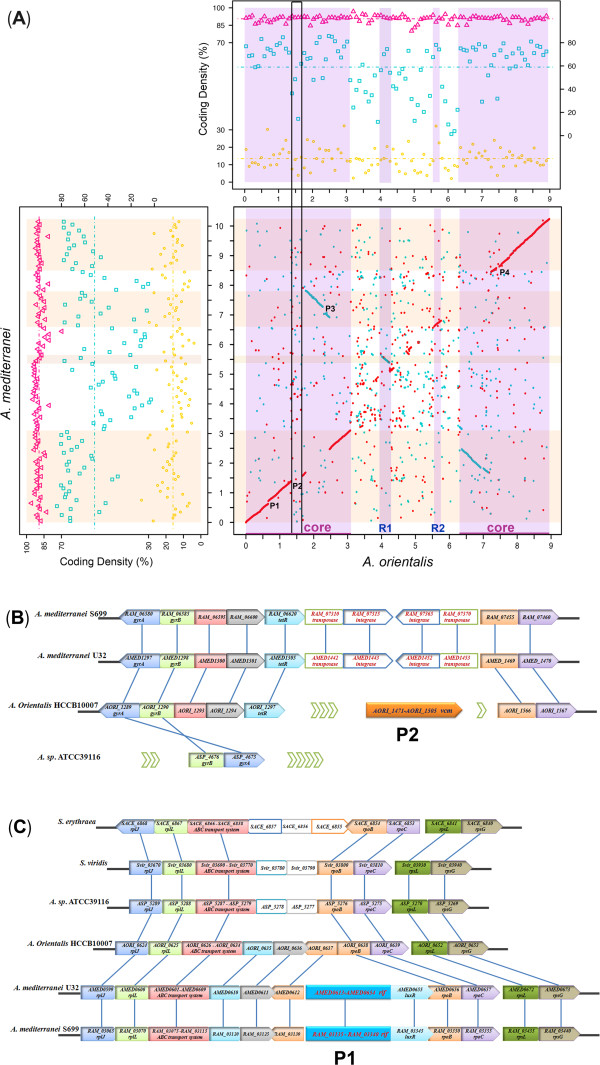
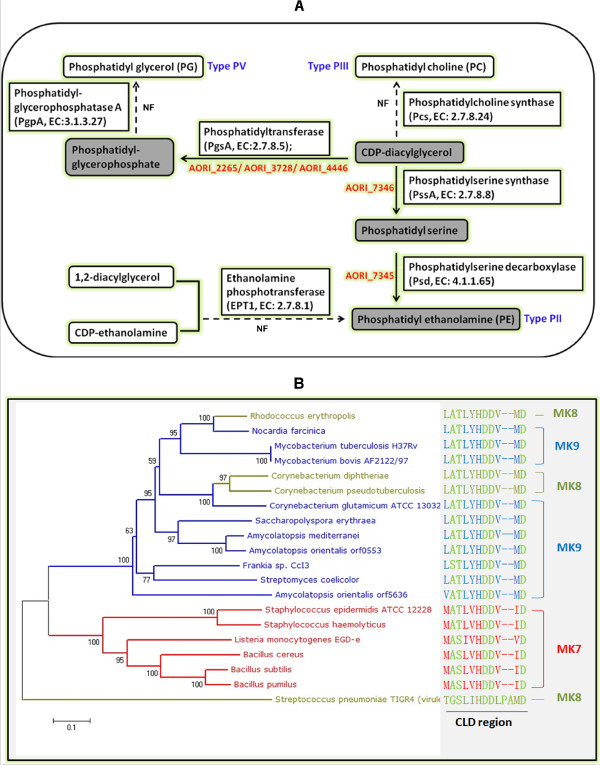
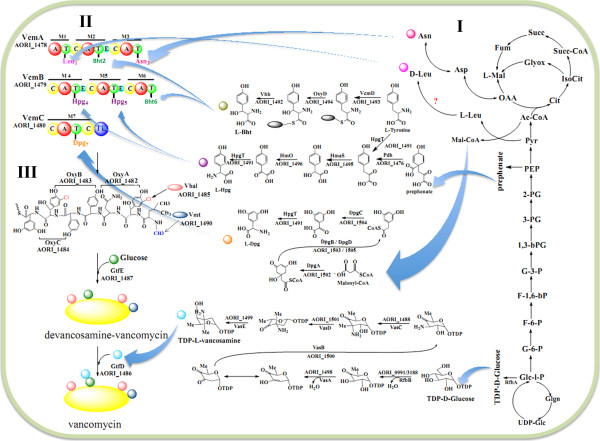
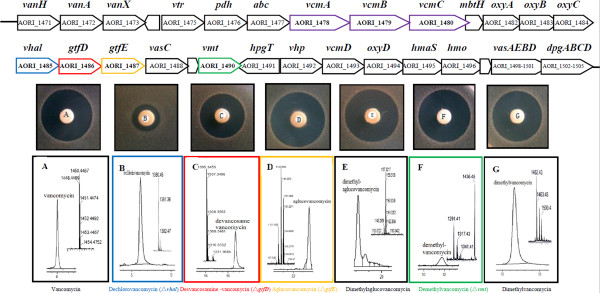
Results: The complete genome of A. orientalis HCCB10007 comprises an 8,948,591-bp circular chromosome and a 33,499-bp dissociated plasmid. In total, 8,121 protein-coding sequences were predicted, and the species-specific genomic features of A. orientalis were analyzed in comparison with that of A. mediterranei. The common characteristics of Amycolatopsis genomes were revealed via intra- and inter-generic comparative genomic analyses within the domain of actinomycetes, and led directly to the development of sequence-based Amycolatopsis molecular chemotaxonomic characteristics (MCCs). The chromosomal core/quasi-core and non-core configurations of the A. orientalis and the A. mediterranei genome were analyzed reciprocally, with respect to further understanding both the discriminable criteria and the evolutionary implementation. In addition, 26 gene clusters related to secondary metabolism, including the 64-kb vcm cluster, were identified in the genome. Employing a customized PCR-targeting-based mutagenesis system along with the biochemical identification of vancomycin variants produced by the mutants, we were able to experimentally characterize a halogenase, a methyltransferase and two glycosyltransferases encoded in the vcm cluster. The broad substrate spectra characteristics of these modification enzymes were inferred.
Conclusions: This study not only extended the genetic knowledge of the genus Amycolatopsis and the biochemical knowledge of vcm-related post-assembly tailoring enzymes, but also developed methodology useful for in vivo studies in A. orientalis, which has been widely considered as a barrier in this field.
Figures
Similar articles
-
Characterization of plasmid pXL100 from Amycolatopsis orientalis HCCB10007 and construction of a shuttle vector.J Basic Microbiol. 2015 Feb;55(2):247-54. doi: 10.1002/jobm.201400210. Epub 2014 Nov 11. J Basic Microbiol. 2015. PMID: 25384460
-
Complete genome sequence of Amycolatopsis orientalis CPCC200066, the producer of norvancomycin.J Biotechnol. 2017 Apr 10;247:6-10. doi: 10.1016/j.jbiotec.2017.02.013. Epub 2017 Feb 16. J Biotechnol. 2017. PMID: 28216102
-
Complete genome sequence of the rifamycin SV-producing Amycolatopsis mediterranei U32 revealed its genetic characteristics in phylogeny and metabolism.Cell Res. 2010 Oct;20(10):1096-108. doi: 10.1038/cr.2010.87. Epub 2010 Jun 22. Cell Res. 2010. PMID: 20567260
-
Progress in Understanding the Genetic Information and Biosynthetic Pathways behind Amycolatopsis Antibiotics, with Implications for the Continued Discovery of Novel Drugs.Chembiochem. 2016 Jan;17(2):119-28. doi: 10.1002/cbic.201500542. Epub 2015 Nov 26. Chembiochem. 2016. PMID: 26503579 Review.
-
Amycolatopsis mediterranei: A Sixty-Year Journey from Strain Isolation to Unlocking Its Potential of Rifamycin Analogue Production by Combinatorial Biosynthesis.J Nat Prod. 2024 Feb 23;87(2):424-438. doi: 10.1021/acs.jnatprod.3c00686. Epub 2024 Jan 30. J Nat Prod. 2024. PMID: 38289177 Review.
Cited by
-
Elucidation of the di-c-glycosylation steps during biosynthesis of the antitumor antibiotic, kidamycin.Front Bioeng Biotechnol. 2022 Aug 25;10:985696. doi: 10.3389/fbioe.2022.985696. eCollection 2022. Front Bioeng Biotechnol. 2022. PMID: 36091425 Free PMC article.
-
Draft Genome Sequence of Norvancomycin-Producing Strain Amycolatopsis orientalis CPCC200066.Genome Announc. 2015 May 14;3(3):e00296-15. doi: 10.1128/genomeA.00296-15. Genome Announc. 2015. PMID: 25977416 Free PMC article.
-
A rare peptide scaffold in kineomicins, the glycopeptide antibiotics produced by Actinokineospora auranticolor DSM 44650.Commun Chem. 2025 May 3;8(1):134. doi: 10.1038/s42004-025-01534-x. Commun Chem. 2025. PMID: 40319198 Free PMC article.
-
Metabolomic analysis in Amycolatopsis keratiniphila disrupted the competing ECO0501 pathway for enhancing the accumulation of vancomycin.World J Microbiol Biotechnol. 2024 Aug 10;40(10):297. doi: 10.1007/s11274-024-04105-9. World J Microbiol Biotechnol. 2024. PMID: 39126539
-
Glycopeptide Antibiotic Resistance Genes: Distribution and Function in the Producer Actinomycetes.Front Microbiol. 2020 Jun 17;11:1173. doi: 10.3389/fmicb.2020.01173. eCollection 2020. Front Microbiol. 2020. PMID: 32655512 Free PMC article. Review.
References
-
- Chang S, Sievert DM, Hageman JC, Boulton ML, Tenover FC, Downes FP, Shah S, Rudrik JT, Pupp GR, Brown WJ, Cardo D, Fridkin SK. Infection with vancomycin-resistant Staphylococcus aureus containing the vanA resistance gene. N Engl J Med. 2003;348(14):1342–1347. doi: 10.1056/NEJMoa025025. - DOI - PubMed
Publication types
MeSH terms
Substances
Associated data
- Actions
- Actions
LinkOut - more resources
Full Text Sources
Other Literature Sources
Medical
Molecular Biology Databases
