

Effective filtering strategies to improve data quality from population-based whole exome sequencing studies
- PMID: 24884706
- PMCID: PMC4098776
- DOI: 10.1186/1471-2105-15-125
Effective filtering strategies to improve data quality from population-based whole exome sequencing studies
Abstract
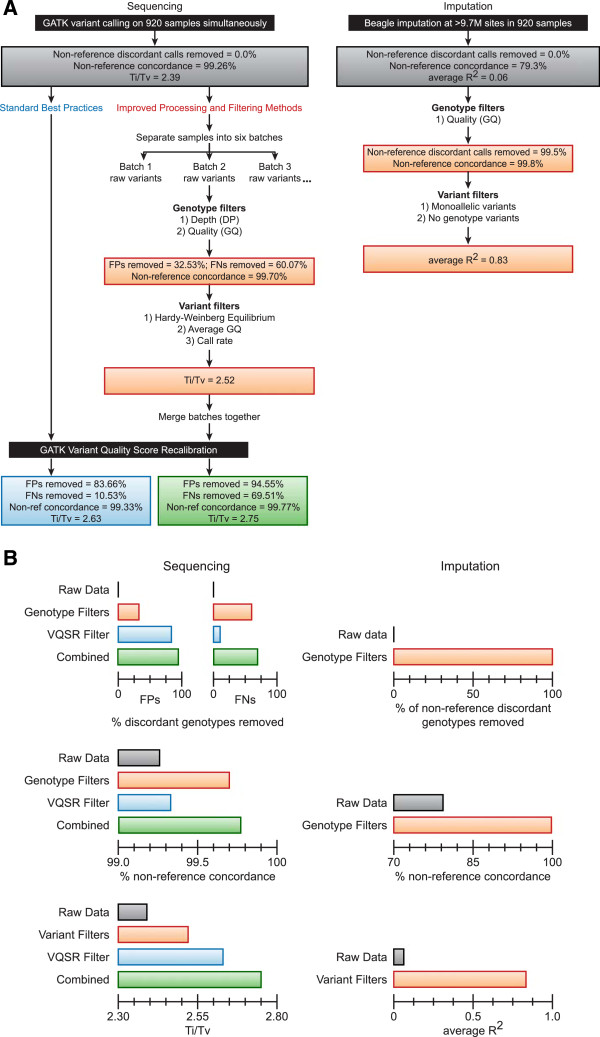
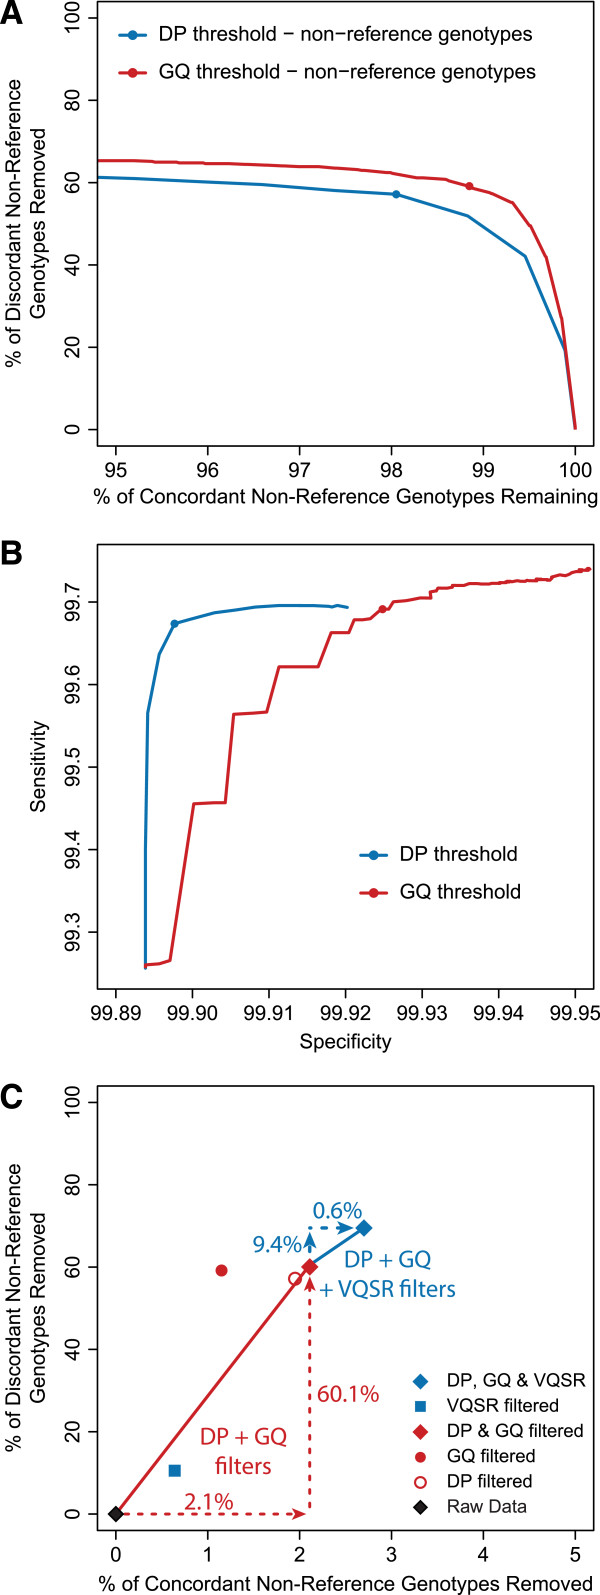
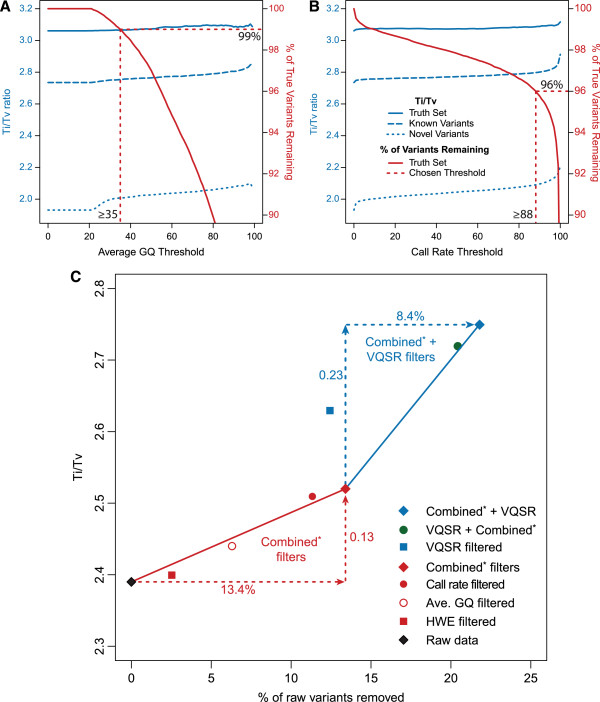
Background: Genotypes generated in next generation sequencing studies contain errors which can significantly impact the power to detect signals in common and rare variant association tests. These genotyping errors are not explicitly filtered by the standard GATK Variant Quality Score Recalibration (VQSR) tool and thus remain a source of errors in whole exome sequencing (WES) projects that follow GATK's recommended best practices. Therefore, additional data filtering methods are required to effectively remove these errors before performing association analyses with complex phenotypes. Here we empirically derive thresholds for genotype and variant filters that, when used in conjunction with the VQSR tool, achieve higher data quality than when using VQSR alone.
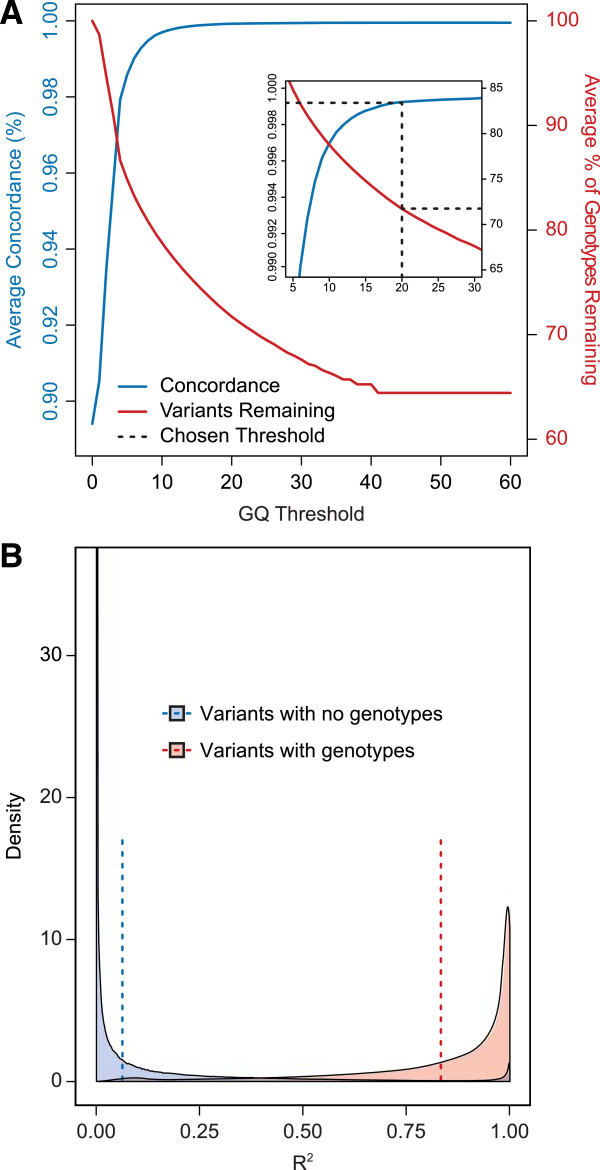
Results: The detailed filtering strategies improve the concordance of sequenced genotypes with array genotypes from 99.33% to 99.77%; improve the percent of discordant genotypes removed from 10.5% to 69.5%; and improve the Ti/Tv ratio from 2.63 to 2.75. We also demonstrate that managing batch effects by separating samples based on different target capture and sequencing chemistry protocols results in a final data set containing 40.9% more high-quality variants. In addition, imputation is an important component of WES studies and is used to estimate common variant genotypes to generate additional markers for association analyses. As such, we demonstrate filtering methods for imputed data that improve genotype concordance from 79.3% to 99.8% while removing 99.5% of discordant genotypes.
Conclusions: The described filtering methods are advantageous for large population-based WES studies designed to identify common and rare variation associated with complex diseases. Compared to data processed through standard practices, these strategies result in substantially higher quality data for common and rare association analyses.
Figures
Similar articles
-
Ionizing Radiation Alters the Transition/Transversion Ratio in the Exome of Human Gingiva Fibroblasts.Health Phys. 2020 Jul;119(1):109-117. doi: 10.1097/HP.0000000000001251. Health Phys. 2020. PMID: 32483046
-
Low-depth genotyping-by-sequencing (GBS) in a bovine population: strategies to maximize the selection of high quality genotypes and the accuracy of imputation.BMC Genet. 2017 Apr 5;18(1):32. doi: 10.1186/s12863-017-0501-y. BMC Genet. 2017. PMID: 28381212 Free PMC article.
-
Impact of variant-level batch effects on identification of genetic risk factors in large sequencing studies.PLoS One. 2021 Apr 16;16(4):e0249305. doi: 10.1371/journal.pone.0249305. eCollection 2021. PLoS One. 2021. PMID: 33861770 Free PMC article.
-
Exome sequencing explained: a practical guide to its clinical application.Brief Funct Genomics. 2016 Sep;15(5):374-84. doi: 10.1093/bfgp/elv054. Epub 2015 Dec 9. Brief Funct Genomics. 2016. PMID: 26654982 Review.
-
Implementation of Exome Sequencing to Identify Rare Genetic Diseases.Methods Mol Biol. 2024;2719:79-98. doi: 10.1007/978-1-0716-3461-5_5. Methods Mol Biol. 2024. PMID: 37803113 Review.
Cited by
-
Common genetic variation in the autoimmune regulator (AIRE) locus is associated with autoimmune Addison's disease in Sweden.Sci Rep. 2018 May 30;8(1):8395. doi: 10.1038/s41598-018-26842-2. Sci Rep. 2018. PMID: 29849176 Free PMC article.
-
Detailed comparison of two popular variant calling packages for exome and targeted exon studies.PeerJ. 2014 Sep 30;2:e600. doi: 10.7717/peerj.600. eCollection 2014. PeerJ. 2014. PMID: 25289185 Free PMC article.
-
The Parkinson's disease risk gene cathepsin B promotes fibrillar alpha-synuclein clearance, lysosomal function and glucocerebrosidase activity in dopaminergic neurons.bioRxiv [Preprint]. 2023 Nov 15:2023.11.11.566693. doi: 10.1101/2023.11.11.566693. bioRxiv. 2023. Update in: Mol Neurodegener. 2024 Nov 25;19(1):88. doi: 10.1186/s13024-024-00779-9. PMID: 38014143 Free PMC article. Updated. Preprint.
-
Association of DOCK8, IL17RA, and KLK12 Polymorphisms with Atopic Dermatitis in Koreans.Ann Dermatol. 2020 Jun;32(3):197-205. doi: 10.5021/ad.2020.32.3.197. Epub 2020 Apr 24. Ann Dermatol. 2020. PMID: 33911738 Free PMC article.
-
Clinical validation of genomic functional screen data: Analysis of observed BRCA1 variants in an unselected population cohort.HGG Adv. 2022 Jan 8;3(2):100086. doi: 10.1016/j.xhgg.2022.100086. eCollection 2022 Apr 14. HGG Adv. 2022. PMID: 35128484 Free PMC article.
References
-
- Kiezun A, Garimella K, Do R, Stitziel NO, Neale BM, McLaren PJ, Gupta N, Sklar P, Sullivan PF, Moran JL, Hultman CM, Lichtenstein P, Magnusson P, Lehner T, Shugart YY, Price AL, de Bakker PI, Purcell SM, Sunyaev SR. Exome sequencing and the genetic basis of complex traits. Nat Genet. 2012;44(6):623–630. doi: 10.1038/ng.2303. - DOI - PMC - PubMed
Publication types
MeSH terms
Grants and funding
LinkOut - more resources
Full Text Sources
Other Literature Sources
Research Materials
