

Functional characterization of a Penicillium chrysogenum mutanase gene induced upon co-cultivation with Bacillus subtilis
- PMID: 24884713
- PMCID: PMC4077275
- DOI: 10.1186/1471-2180-14-114
Functional characterization of a Penicillium chrysogenum mutanase gene induced upon co-cultivation with Bacillus subtilis
Abstract
Background: Microbial gene expression is strongly influenced by environmental growth conditions. Comparison of gene expression under different conditions is frequently used for functional analysis and to unravel regulatory networks, however, gene expression responses to co-cultivation with other microorganisms, a common occurrence in nature, is rarely studied under laboratory conditions. To explore cellular responses of the antibiotic-producing fungus Penicillium chrysogenum to prokaryotes, the present study investigates its transcriptional responses during co-cultivation with Bacillus subtilis.
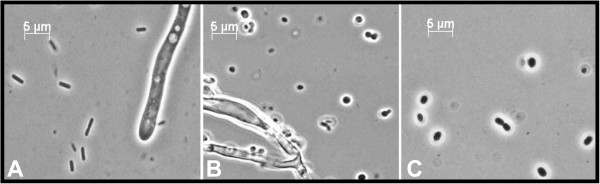
Results: Steady-state glucose-limited chemostats of P. chrysogenum grown under penillicin-non-producing conditions were inoculated with B. subtilis. Physiological and transcriptional responses of P. chrysogenum in the resulting mixed culture were monitored over 72 h. Under these conditions, B. subtilis outcompeted P. chrysogenum, as reflected by a three-fold increase of the B. subtilis population size and a two-fold reduction of the P. chrysogenum biomass concentration. Genes involved in the penicillin pathway and in synthesis of the penicillin precursors and side-chain were unresponsive to the presence of B. subtilis. Moreover, Penicillium polyketide synthase and nonribosomal peptide synthase genes were either not expressed or down-regulated. Among the highly responsive genes, two putative α-1,3 endoglucanase (mutanase) genes viz Pc12g07500 and Pc12g13330 were upregulated by more than 15-fold and 8-fold, respectively. Measurement of enzyme activity in the supernatant of mixed culture confirmed that the co-cultivation with B. subtilis induced mutanase production. Mutanase activity was neither observed in pure cultures of P. chrysogenum or B. subtilis, nor during exposure of P. chrysogenum to B. subtilis culture supernatants or heat-inactivated B. subtilis cells. However, mutanase production was observed in cultures of P. chrysogenum exposed to filter-sterilized supernatants of mixed cultures of P. chrysogenum and B. subtilis. Heterologous expression of Pc12g07500 and Pc12g13330 genes in Saccharomyces cerevisiae confirmed that Pc12g07500 encoded an active α-1,3 endoglucanase.
Conclusion: Time-course transcriptional profiling of P. chrysogenum revealed differentially expressed genes during co-cultivation with B. subtilis. Penicillin production was not induced under these conditions. However, induction of a newly characterized P. chrysogenum gene encoding α-1,3 endoglucanase may enhance the efficacy of fungal antibiotics by degrading bacterial exopolysaccharides.
Figures


Similar articles
-
Transcriptional and bioinformatic analysis of the 56.8 kb DNA region amplified in tandem repeats containing the penicillin gene cluster in Penicillium chrysogenum.Fungal Genet Biol. 2006 Sep;43(9):618-29. doi: 10.1016/j.fgb.2006.03.001. Epub 2006 May 18. Fungal Genet Biol. 2006. PMID: 16713314
-
Exploring and dissecting genome-wide gene expression responses of Penicillium chrysogenum to phenylacetic acid consumption and penicillinG production.BMC Genomics. 2009 Feb 10;10:75. doi: 10.1186/1471-2164-10-75. BMC Genomics. 2009. PMID: 19203396 Free PMC article.
-
Genome-wide analysis of differentially expressed genes from Penicillium chrysogenum grown with a repressing or a non-repressing carbon source.Curr Genet. 2006 Feb;49(2):85-96. doi: 10.1007/s00294-005-0029-y. Epub 2005 Dec 16. Curr Genet. 2006. PMID: 16362424
-
Key role of LaeA and velvet complex proteins on expression of β-lactam and PR-toxin genes in Penicillium chrysogenum: cross-talk regulation of secondary metabolite pathways.J Ind Microbiol Biotechnol. 2017 May;44(4-5):525-535. doi: 10.1007/s10295-016-1830-y. Epub 2016 Aug 26. J Ind Microbiol Biotechnol. 2017. PMID: 27565675 Review.
-
Biosynthetic concepts for the production of β-lactam antibiotics in Penicillium chrysogenum.Biotechnol J. 2012 Feb;7(2):225-36. doi: 10.1002/biot.201100065. Epub 2011 Nov 7. Biotechnol J. 2012. PMID: 22057844 Review.
Cited by
-
Studying the Gene Expression of Penicillium rubens Under the Effect of Eight Essential Oils.Antibiotics (Basel). 2020 Jun 19;9(6):343. doi: 10.3390/antibiotics9060343. Antibiotics (Basel). 2020. PMID: 32575356 Free PMC article.
-
The Impact of the Culture Regime on the Metabolome and Anti-Phytopathogenic Activity of Marine Fungal Co-Cultures.Mar Drugs. 2024 Jan 27;22(2):66. doi: 10.3390/md22020066. Mar Drugs. 2024. PMID: 38393037 Free PMC article.
-
Design of Fungal Co-Cultivation Based on Comparative Metabolomics and Bioactivity for Discovery of Marine Fungal Agrochemicals.Mar Drugs. 2020 Jan 23;18(2):73. doi: 10.3390/md18020073. Mar Drugs. 2020. PMID: 31979232 Free PMC article.
-
Insights into microbial cryptic gene activation and strain improvement: principle, application and technical aspects.J Antibiot (Tokyo). 2017 Jan;70(1):25-40. doi: 10.1038/ja.2016.82. Epub 2016 Jul 6. J Antibiot (Tokyo). 2017. PMID: 27381522 Review.
-
The low affinity glucose transporter HxtB is also involved in glucose signalling and metabolism in Aspergillus nidulans.Sci Rep. 2017 Mar 31;7:45073. doi: 10.1038/srep45073. Sci Rep. 2017. PMID: 28361917 Free PMC article.
References
-
- Thykaer J, Nielsen J. Metabolic engineering of beta-lactam production. Metab Eng. 2003;5:56–69. - PubMed
-
- van den Berg MA, Albang R, Albermann K, Badger JH, Daran JM, Driessen AJM, Estrada CG, Fedorova ND, Harris D, Heijne W, Joardar V, Kiel J, Kovalchuk A, Martin JF, Niermann WC, Nijland JG, Pronk JT, Roubos JA, van der Klie I, Van Peij NNME, Veenhuis M, Von Dohren H, Wagner C, Wortman J, Bovenberg RAL. Genome sequencing and analysis of the filamentous fungus Penicillium chrysogenum. Nat Biotechnol. 2008;26:1161–1168. - PubMed
-
- Harris DM, van der Krogt ZA, Klaassen P, Raamsdonk LM, Hage S, van den Berg MA, Bovenberg RA, Pronk JT, Daran JM. Exploring and dissecting genome-wide gene expression responses of Penicillium chrysogenum to phenylacetic acid consumption and penicillinG production. BMC Genomics. 2009;10:75. - PMC - PubMed
Publication types
MeSH terms
Substances
LinkOut - more resources
Full Text Sources
Other Literature Sources
Molecular Biology Databases
