

Increased genetic diversity of ADME genes in African Americans compared with their putative ancestral source populations and implications for pharmacogenomics
- PMID: 24884825
- PMCID: PMC4021503
- DOI: 10.1186/1471-2156-15-52
Increased genetic diversity of ADME genes in African Americans compared with their putative ancestral source populations and implications for pharmacogenomics
Abstract
Background: African Americans have been treated as a representative population for African ancestry for many purposes, including pharmacogenomic studies. However, the contribution of European ancestry is expected to result in considerable differences in the genetic architecture of African American individuals compared with an African genome. In particular, the genetic admixture influences the genomic diversity of drug metabolism-related genes, and may cause high heterogeneity of drug responses in admixed populations such as African Americans.
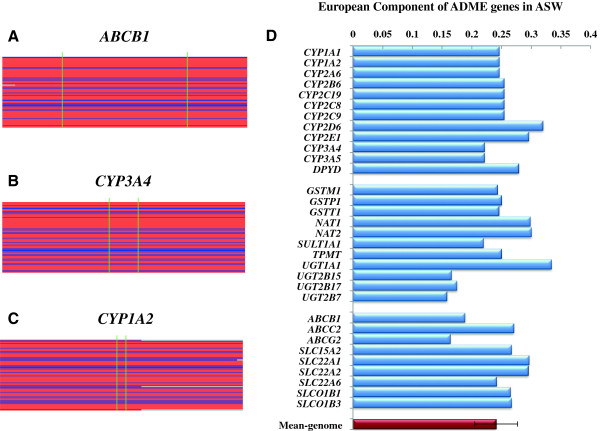
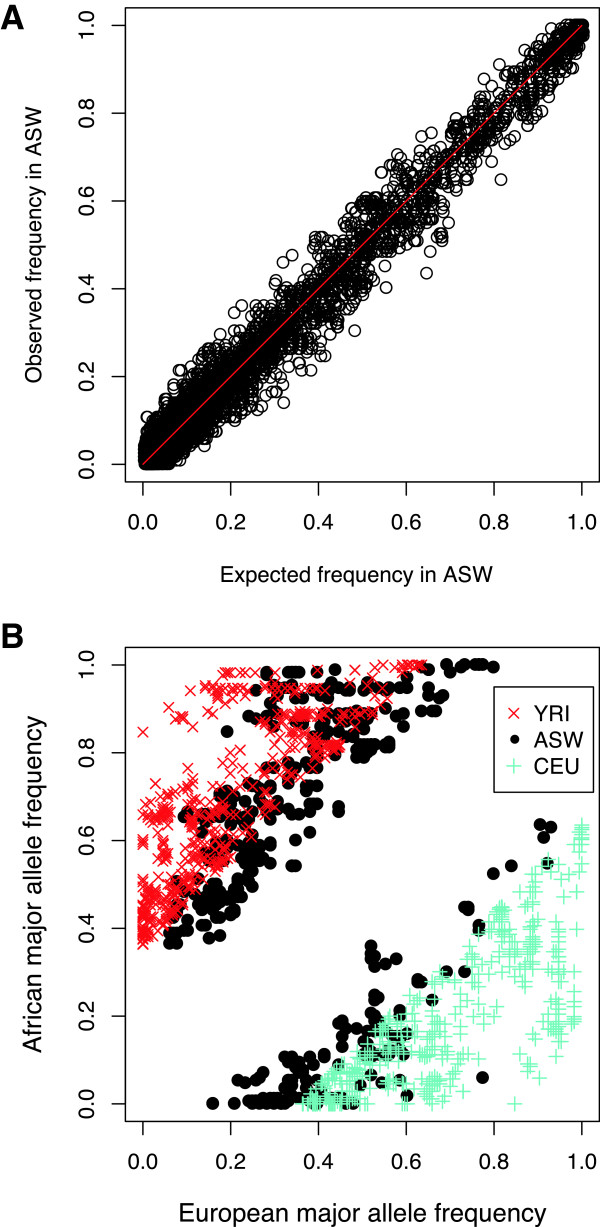
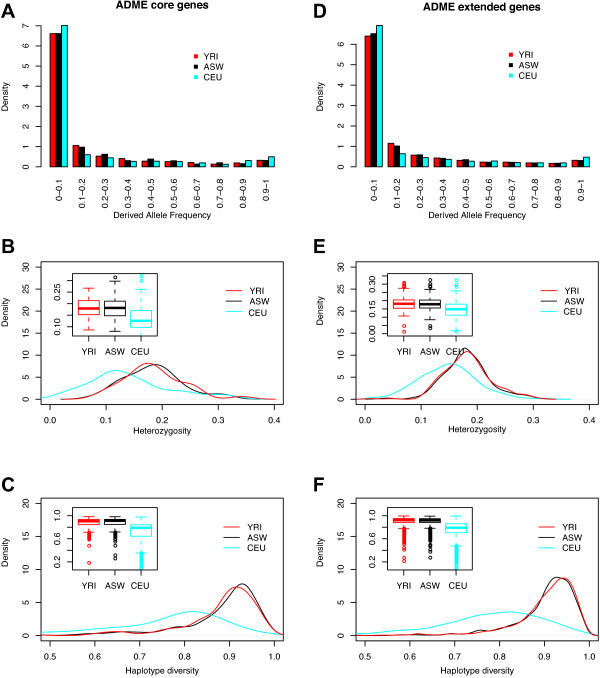
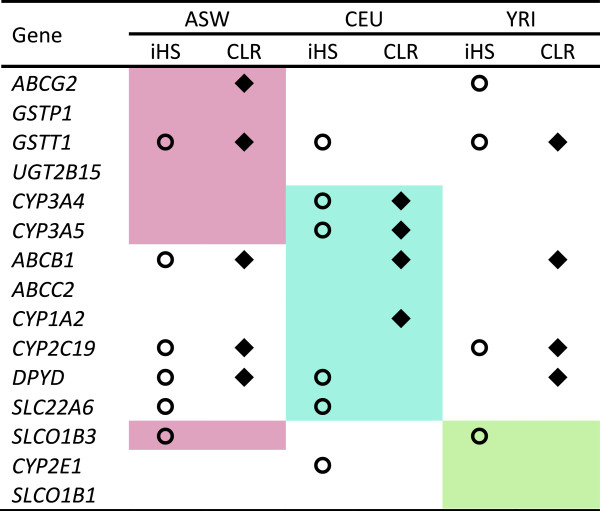
Results: The genomic ancestry information of African-American (ASW) samples was obtained from data of the 1000 Genomes Project, and local ancestral components were also extracted for 32 core genes and 252 extended genes, which are associated with drug absorption, distribution, metabolism, and excretion (ADME) genes. As expected, the global genetic diversity pattern in ASW was determined by the contributions of its putative ancestral source populations, and the whole profiles of ADME genes in ASW are much closer to those in YRI than in CEU. However, we observed much higher diversity in some functionally important ADME genes in ASW than either CEU or YRI, which could be a result of either genetic drift or natural selection, and we identified some signatures of the latter. We analyzed the clinically relevant polymorphic alleles and haplotypes, and found that 28 functional mutations (including 3 missense, 3 splice, and 22 regulator sites) exhibited significantly higher differentiation between the three populations.
Conclusions: Analysis of the genetic diversity of ADME genes showed differentiation between admixed population and its ancestral source populations. In particular, the different genetic diversity between ASW and YRI indicated that the ethnic differences in pharmacogenomic studies are broadly existed despite that African ancestry is dominant in Africans Americans. This study should advance our understanding of the genetic basis of the drug response heterogeneity between populations, especially in the case of population admixture, and have significant implications for evaluating potential inter-population heterogeneity in drug treatment effects.
Figures

Similar articles
-
Detecting Heterogeneity in Population Structure Across the Genome in Admixed Populations.Genetics. 2016 Sep;204(1):43-56. doi: 10.1534/genetics.115.184184. Epub 2016 Jul 20. Genetics. 2016. PMID: 27440868 Free PMC article.
-
Ancestral components of admixed genomes in a Mexican cohort.PLoS Genet. 2011 Dec;7(12):e1002410. doi: 10.1371/journal.pgen.1002410. Epub 2011 Dec 15. PLoS Genet. 2011. PMID: 22194699 Free PMC article.
-
Pharmacogenomics in the Americas: the impact of genetic admixture.Curr Drug Targets. 2006 Dec;7(12):1649-58. doi: 10.2174/138945006779025392. Curr Drug Targets. 2006. PMID: 17168840 Review.
-
Local Ancestry Inference Based on Population-Specific Single-Nucleotide Polymorphisms-A Study of Admixed Populations in the 1000 Genomes Project.Genes (Basel). 2024 Aug 21;15(8):1099. doi: 10.3390/genes15081099. Genes (Basel). 2024. PMID: 39202458 Free PMC article.
-
The genomic landscape of African populations in health and disease.Hum Mol Genet. 2017 Oct 1;26(R2):R225-R236. doi: 10.1093/hmg/ddx253. Hum Mol Genet. 2017. PMID: 28977439 Free PMC article. Review.
Cited by
-
Targeted ultra-deep sequencing of a South African Bantu-speaking cohort to comprehensively map and characterize common and novel variants in 65 pharmacologically-related genes.Pharmacogenet Genomics. 2019 Sep;29(7):167-178. doi: 10.1097/FPC.0000000000000380. Pharmacogenet Genomics. 2019. PMID: 31162291 Free PMC article.
-
Structural variation at the CYP2C locus: Characterization of deletion and duplication alleles.Hum Mutat. 2019 Nov;40(11):e37-e51. doi: 10.1002/humu.23855. Hum Mutat. 2019. PMID: 31260137 Free PMC article.
-
Independent replication of polymorphisms predicting toxicity in breast cancer patients randomized between dose-dense and docetaxel-containing adjuvant chemotherapy.Oncotarget. 2017 Nov 27;8(69):113531-113542. doi: 10.18632/oncotarget.22697. eCollection 2017 Dec 26. Oncotarget. 2017. PMID: 29371927 Free PMC article.
-
Acute Generalized Exanthematous Pustulosis in an African American Male Caused by Trimethoprim-Sulfamethoxazole.Cureus. 2020 Aug 6;12(8):e9591. doi: 10.7759/cureus.9591. Cureus. 2020. PMID: 32923197 Free PMC article.
-
Symptom Experience, Management, and Outcomes According to Race and Social Determinants Including Genomics, Epigenomics, and Metabolomics (SEMOARS + GEM): an Explanatory Model for Breast Cancer Treatment Disparity.J Cancer Educ. 2020 Jun;35(3):428-440. doi: 10.1007/s13187-019-01571-w. J Cancer Educ. 2020. PMID: 31392599 Free PMC article.
References
Publication types
MeSH terms
LinkOut - more resources
Full Text Sources
Other Literature Sources
Research Materials
