

The effects of chemical interactions and culture history on the colonization of structured habitats by competing bacterial populations
- PMID: 24884963
- PMCID: PMC4032360
- DOI: 10.1186/1471-2180-14-116
The effects of chemical interactions and culture history on the colonization of structured habitats by competing bacterial populations
Abstract
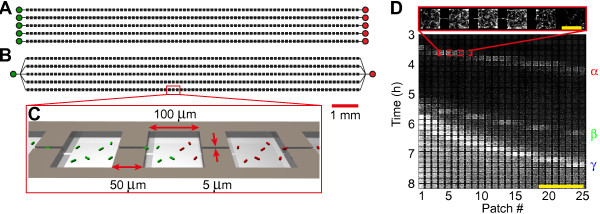
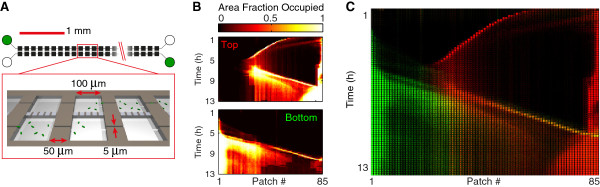
Background: Bacterial habitats, such as soil and the gut, are structured at the micrometer scale. Important aspects of microbial life in such spatial ecosystems are migration and colonization. Here we explore the colonization of a structured ecosystem by two neutrally labeled strains of Escherichia coli. Using time-lapse microscopy we studied the colonization of one-dimensional arrays of habitat patches linked by connectors, which were invaded by the two E. coli strains from opposite sides.
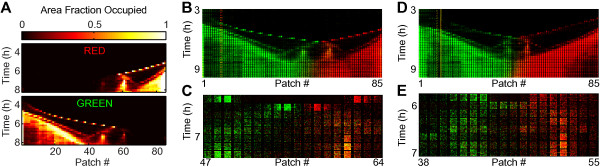
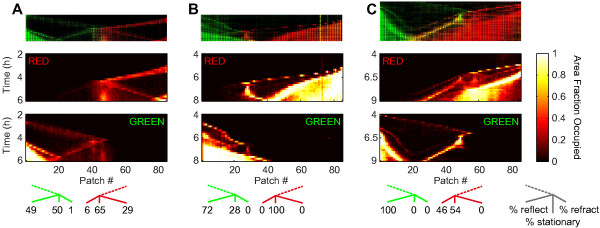
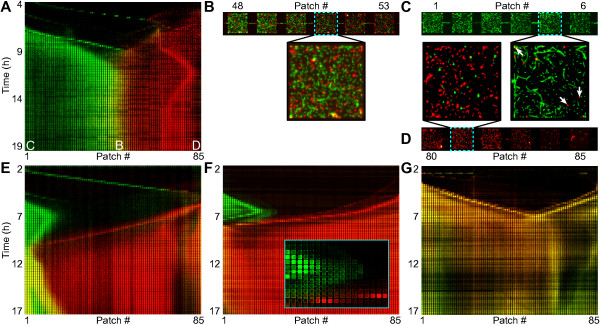
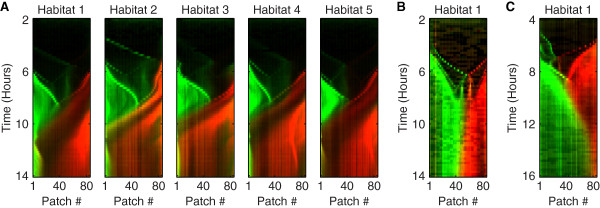
Results: The two strains colonize a habitat from opposite sides by a series of traveling waves followed by an expansion front. When population waves collide, they branch into a continuing traveling wave, a reflected wave and a stationary population. When the two strains invade the landscape from opposite sides, they remain segregated in space and often one population will displace the other from most of the habitat. However, when the strains are co-cultured before entering the habitats, they colonize the habitat together and do not separate spatially. Using physically separated, but diffusionally coupled, habitats we show that colonization waves and expansion fronts interact trough diffusible molecules, and not by direct competition for space. Furthermore, we found that colonization outcome is influenced by a culture's history, as the culture with the longest doubling time in bulk conditions tends to take over the largest fraction of the habitat. Finally, we observed that population distributions in parallel habitats located on the same device and inoculated with cells from the same overnight culture are significantly more similar to each other than to patterns in identical habitats located on different devices inoculated with cells from different overnight cultures, even tough all cultures were started from the same -80°C frozen stock.
Conclusions: We found that the colonization of spatially structure habitats by two interacting populations can lead to the formation of complex, but reproducible, spatiotemporal patterns. Furthermore, we showed that chemical interactions between two populations cause them to remain spatially segregated while they compete for habitat space. Finally, we observed that growth properties in bulk conditions correlate with the outcome of habitat colonization. Together, our data show the crucial roles of chemical interactions between populations and a culture's history in determining the outcome of habitat colonization.
Figures
Similar articles
-
An evolutionarily stable strategy to colonize spatially extended habitats.Nature. 2019 Nov;575(7784):664-668. doi: 10.1038/s41586-019-1734-x. Epub 2019 Nov 6. Nature. 2019. PMID: 31695198 Free PMC article.
-
The role of colonization in the dynamics of patchy populations of a cyclic vole species.Oecologia. 2013 Sep;173(1):161-7. doi: 10.1007/s00442-013-2614-y. Epub 2013 Feb 27. Oecologia. 2013. PMID: 23443355
-
Fine-scale habitat heterogeneity favours the coexistence of supergene-controlled social forms in Formica selysi.BMC Ecol Evol. 2021 Feb 14;21(1):24. doi: 10.1186/s12862-020-01742-0. BMC Ecol Evol. 2021. PMID: 33583395 Free PMC article.
-
The functional value of Caribbean coral reef, seagrass and mangrove habitats to ecosystem processes.Adv Mar Biol. 2006;50:57-189. doi: 10.1016/S0065-2881(05)50002-6. Adv Mar Biol. 2006. PMID: 16782451 Review.
-
Quantitative Clinical Imaging Methods for Monitoring Intratumoral Evolution.Methods Mol Biol. 2017;1513:61-81. doi: 10.1007/978-1-4939-6539-7_6. Methods Mol Biol. 2017. PMID: 27807831 Review.
Cited by
-
Bacterial predator-prey dynamics in microscale patchy landscapes.Proc Biol Sci. 2016 Feb 10;283(1824):20152154. doi: 10.1098/rspb.2015.2154. Proc Biol Sci. 2016. PMID: 26865299 Free PMC article.
-
Assembly and Tracking of Microbial Community Development within a Microwell Array Platform.J Vis Exp. 2017 Jun 6;(124):55701. doi: 10.3791/55701. J Vis Exp. 2017. PMID: 28654053 Free PMC article.
-
Microfluidic and mathematical modeling of aquatic microbial communities.Anal Bioanal Chem. 2021 Apr;413(9):2331-2344. doi: 10.1007/s00216-020-03085-7. Epub 2020 Nov 26. Anal Bioanal Chem. 2021. PMID: 33244684 Free PMC article. Review.
-
Nutrient-responsive regulation determines biodiversity in a colicin-mediated bacterial community.BMC Biol. 2014 Aug 27;12:68. doi: 10.1186/s12915-014-0068-2. BMC Biol. 2014. PMID: 25159553 Free PMC article.
-
Variance in Landscape Connectivity Shifts Microbial Population Scaling.Front Microbiol. 2022 Apr 1;13:831790. doi: 10.3389/fmicb.2022.831790. eCollection 2022. Front Microbiol. 2022. PMID: 35464924 Free PMC article.
References
Publication types
MeSH terms
Grants and funding
LinkOut - more resources
Full Text Sources
Other Literature Sources
