

Zoom in at African country level: potential climate induced changes in areas of suitability for survival of malaria vectors
- PMID: 24885061
- PMCID: PMC4022448
- DOI: 10.1186/1476-072X-13-12
Zoom in at African country level: potential climate induced changes in areas of suitability for survival of malaria vectors
Abstract
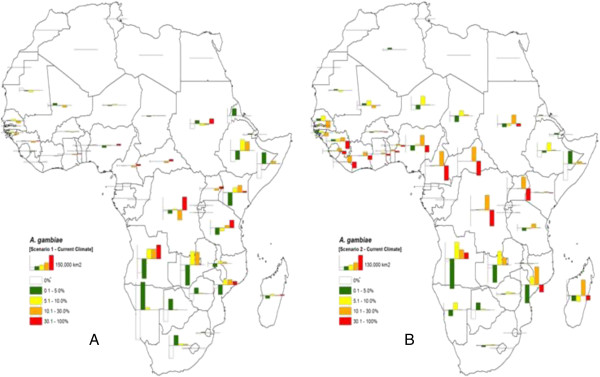
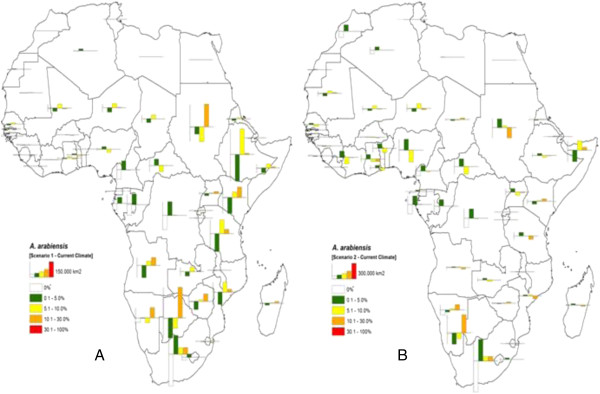
Background: Predicting anopheles vectors' population densities and boundary shifts is crucial in preparing for malaria risks and unanticipated outbreaks. Although shifts in the distribution and boundaries of the major malaria vectors (Anopheles gambiae s.s. and An. arabiensis) across Africa have been predicted, quantified areas of absolute change in zone of suitability for their survival have not been defined. In this study, we have quantified areas of absolute change conducive for the establishment and survival of these vectors, per African country, under two climate change scenarios and based on our findings, highlight practical measures for effective malaria control in the face of changing climatic patterns.
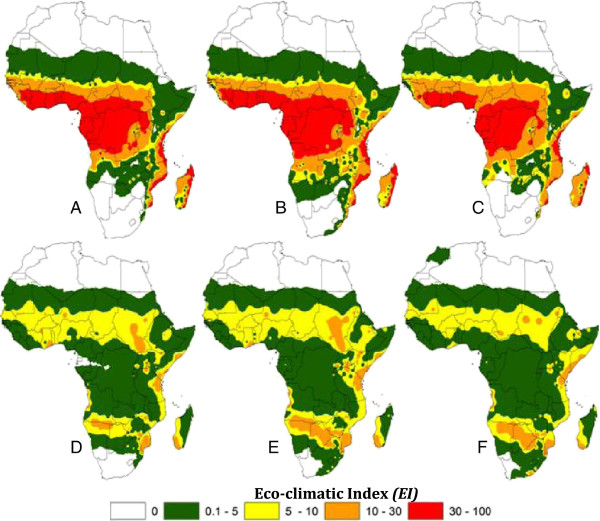
Methods: We developed a model using CLIMEX simulation platform to estimate the potential geographical distribution and seasonal abundance of these malaria vectors in relation to climatic factors (temperature, rainfall and relative humidity). The model yielded an eco-climatic index (EI) describing the total favourable geographical locations for the species. The EI values were classified and exported to a GIS package. Using ArcGIS, the EI shape points were clipped to the extent of Africa and then converted to a raster layer using Inverse Distance Weighted (IDW) interpolation method. Generated maps were then transformed into polygon-based geo-referenced data set and their areas computed and expressed in square kilometers (km(2)).
Results: Five classes of EI were derived indicating the level of survivorship of these malaria vectors. The proportion of areas increasing or decreasing in level of survival of these malaria vectors will be more pronounced in eastern and southern African countries than those in western Africa. Angola, Ethiopia, Kenya, Mozambique, Tanzania, South Africa and Zambia appear most likely to be affected in terms of absolute change of malaria vectors suitability zones under the selected climate change scenarios.
Conclusion: The potential shifts of these malaria vectors have implications for human exposure to malaria, as recrudescence of the disease is likely to be recorded in several new areas and regions. Therefore, the need to develop, compile and share malaria preventive measures, which can be adapted to different climatic scenarios, remains crucial.
Figures
Similar articles
-
Predicting and mapping malaria under climate change scenarios: the potential redistribution of malaria vectors in Africa.Malar J. 2010 Apr 23;9:111. doi: 10.1186/1475-2875-9-111. Malar J. 2010. PMID: 20416059 Free PMC article.
-
Mapping the ranges and relative abundance of the two principal African malaria vectors, Anopheles gambiae sensu stricto and An. arabiensis, using climate data.Proc Biol Sci. 1998 May 22;265(1399):847-54. doi: 10.1098/rspb.1998.0369. Proc Biol Sci. 1998. PMID: 9633110 Free PMC article.
-
Habitat suitability and ecological niche profile of major malaria vectors in Cameroon.Malar J. 2009 Dec 23;8:307. doi: 10.1186/1475-2875-8-307. Malar J. 2009. PMID: 20028559 Free PMC article.
-
Malaria entomological profile in Tanzania from 1950 to 2010: a review of mosquito distribution, vectorial capacity and insecticide resistance.Tanzan J Health Res. 2011 Dec;13(5 Suppl 1):319-31. Tanzan J Health Res. 2011. PMID: 26591987 Review.
-
The ecology of Anopheles mosquitoes under climate change: case studies from the effects of deforestation in East African highlands.Ann N Y Acad Sci. 2012 Feb;1249:204-10. doi: 10.1111/j.1749-6632.2011.06432.x. Epub 2012 Feb 9. Ann N Y Acad Sci. 2012. PMID: 22320421 Free PMC article. Review.
Cited by
-
The impact of climate change on mosquito-borne diseases in Africa.Pathog Glob Health. 2020 Sep;114(6):287-301. doi: 10.1080/20477724.2020.1783865. Epub 2020 Jun 25. Pathog Glob Health. 2020. PMID: 32584659 Free PMC article.
-
Systematic Review on Diversity and Distribution of Anopheles Species in Gabon: A Fresh Look at the Potential Malaria Vectors and Perspectives.Pathogens. 2022 Jun 9;11(6):668. doi: 10.3390/pathogens11060668. Pathogens. 2022. PMID: 35745522 Free PMC article. Review.
-
Larval and adult environmental temperatures influence the adult reproductive traits of Anopheles gambiae s.s.Parasit Vectors. 2015 Sep 17;8:456. doi: 10.1186/s13071-015-1053-5. Parasit Vectors. 2015. PMID: 26382035 Free PMC article.
-
Impacts of Climate Change on Health and Wellbeing in South Africa.Int J Environ Res Public Health. 2018 Aug 31;15(9):1884. doi: 10.3390/ijerph15091884. Int J Environ Res Public Health. 2018. PMID: 30200277 Free PMC article. Review.
-
malERA: An updated research agenda for combination interventions and modelling in malaria elimination and eradication.PLoS Med. 2017 Nov 30;14(11):e1002453. doi: 10.1371/journal.pmed.1002453. eCollection 2017 Nov. PLoS Med. 2017. PMID: 29190295 Free PMC article. Review.
References
-
- Reiter P. Climate change and mosquito-borne disease: knowing the horse before hitching the cart. Rev sci tech Off int Epiz. 2008;27(2):383–398. - PubMed
Publication types
MeSH terms
LinkOut - more resources
Full Text Sources
Other Literature Sources
Medical
